Sioux vs Cuban Ambulatory Disability
COMPARE
Sioux
Cuban
Ambulatory Disability
Ambulatory Disability Comparison
Sioux
Cubans
6.7%
AMBULATORY DISABILITY
0.1/ 100
METRIC RATING
274th/ 347
METRIC RANK
6.4%
AMBULATORY DISABILITY
4.0/ 100
METRIC RATING
227th/ 347
METRIC RANK
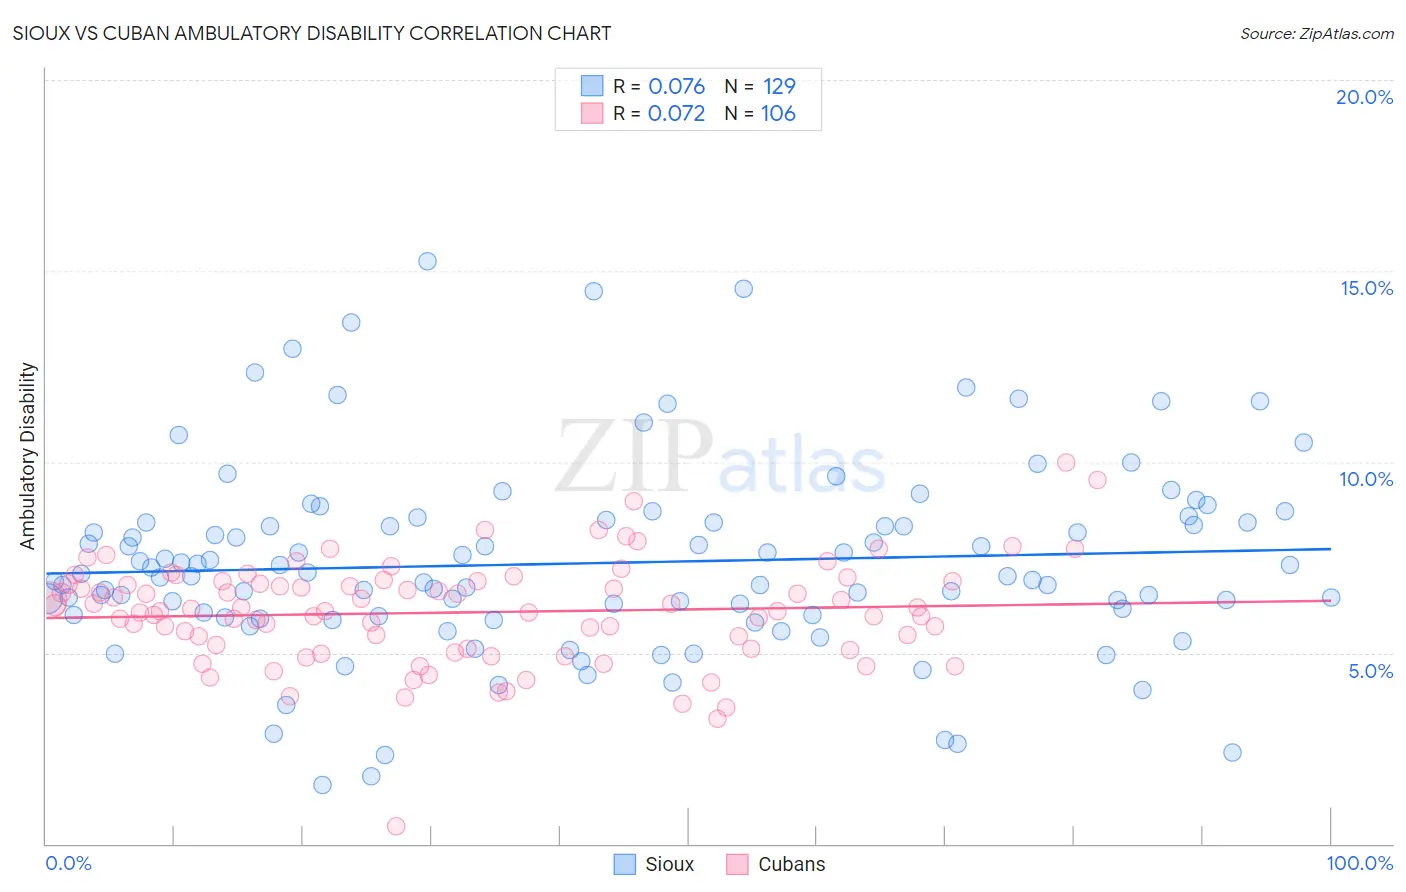
Sioux vs Cuban Ambulatory Disability Correlation Chart
The statistical analysis conducted on geographies consisting of 234,119,186 people shows a slight positive correlation between the proportion of Sioux and percentage of population with ambulatory disability in the United States with a correlation coefficient (R) of 0.076 and weighted average of 6.7%. Similarly, the statistical analysis conducted on geographies consisting of 449,114,501 people shows a slight positive correlation between the proportion of Cubans and percentage of population with ambulatory disability in the United States with a correlation coefficient (R) of 0.072 and weighted average of 6.4%, a difference of 5.2%.
Ambulatory Disability Correlation Summary
| Measurement | Sioux | Cuban |
| Minimum | 1.5% | 0.45% |
| Maximum | 15.2% | 10.0% |
| Range | 13.7% | 9.5% |
| Mean | 7.3% | 6.1% |
| Median | 7.0% | 6.1% |
| Interquartile 25% (IQ1) | 6.0% | 5.1% |
| Interquartile 75% (IQ3) | 8.4% | 6.9% |
| Interquartile Range (IQR) | 2.4% | 1.7% |
| Standard Deviation (Sample) | 2.5% | 1.4% |
| Standard Deviation (Population) | 2.5% | 1.4% |
Similar Demographics by Ambulatory Disability
Demographics Similar to Sioux by Ambulatory Disability
In terms of ambulatory disability, the demographic groups most similar to Sioux are Immigrants from Guyana (6.7%, a difference of 0.060%), Celtic (6.7%, a difference of 0.090%), Jamaican (6.7%, a difference of 0.17%), White/Caucasian (6.7%, a difference of 0.24%), and Immigrants from West Indies (6.7%, a difference of 0.25%).
| Demographics | Rating | Rank | Ambulatory Disability |
| Trinidadians and Tobagonians | 0.2 /100 | #267 | Tragic 6.6% |
| Spanish | 0.2 /100 | #268 | Tragic 6.6% |
| French | 0.1 /100 | #269 | Tragic 6.6% |
| Slovaks | 0.1 /100 | #270 | Tragic 6.7% |
| Immigrants | Trinidad and Tobago | 0.1 /100 | #271 | Tragic 6.7% |
| French Canadians | 0.1 /100 | #272 | Tragic 6.7% |
| Whites/Caucasians | 0.1 /100 | #273 | Tragic 6.7% |
| Sioux | 0.1 /100 | #274 | Tragic 6.7% |
| Immigrants | Guyana | 0.1 /100 | #275 | Tragic 6.7% |
| Celtics | 0.1 /100 | #276 | Tragic 6.7% |
| Jamaicans | 0.1 /100 | #277 | Tragic 6.7% |
| Immigrants | West Indies | 0.1 /100 | #278 | Tragic 6.7% |
| Immigrants | Caribbean | 0.0 /100 | #279 | Tragic 6.7% |
| Pennsylvania Germans | 0.0 /100 | #280 | Tragic 6.8% |
| Yaqui | 0.0 /100 | #281 | Tragic 6.8% |
Demographics Similar to Cubans by Ambulatory Disability
In terms of ambulatory disability, the demographic groups most similar to Cubans are Portuguese (6.4%, a difference of 0.010%), Czechoslovakian (6.4%, a difference of 0.060%), Mexican (6.4%, a difference of 0.17%), Panamanian (6.4%, a difference of 0.32%), and Slavic (6.4%, a difference of 0.33%).
| Demographics | Rating | Rank | Ambulatory Disability |
| Immigrants | Albania | 9.6 /100 | #220 | Tragic 6.3% |
| Hungarians | 9.6 /100 | #221 | Tragic 6.3% |
| German Russians | 9.4 /100 | #222 | Tragic 6.3% |
| Immigrants | Honduras | 7.6 /100 | #223 | Tragic 6.3% |
| Liberians | 7.1 /100 | #224 | Tragic 6.3% |
| Hondurans | 6.3 /100 | #225 | Tragic 6.3% |
| Slavs | 5.1 /100 | #226 | Tragic 6.4% |
| Cubans | 4.0 /100 | #227 | Tragic 6.4% |
| Portuguese | 4.0 /100 | #228 | Tragic 6.4% |
| Czechoslovakians | 3.8 /100 | #229 | Tragic 6.4% |
| Mexicans | 3.5 /100 | #230 | Tragic 6.4% |
| Panamanians | 3.1 /100 | #231 | Tragic 6.4% |
| Assyrians/Chaldeans/Syriacs | 2.4 /100 | #232 | Tragic 6.4% |
| Sub-Saharan Africans | 2.3 /100 | #233 | Tragic 6.4% |
| Immigrants | Liberia | 2.3 /100 | #234 | Tragic 6.4% |