Irish vs Immigrants from Poland Doctorate Degree
COMPARE
Irish
Immigrants from Poland
Doctorate Degree
Doctorate Degree Comparison
Irish
Immigrants from Poland
1.9%
DOCTORATE DEGREE
67.5/ 100
METRIC RATING
162nd/ 347
METRIC RANK
1.7%
DOCTORATE DEGREE
7.4/ 100
METRIC RATING
224th/ 347
METRIC RANK
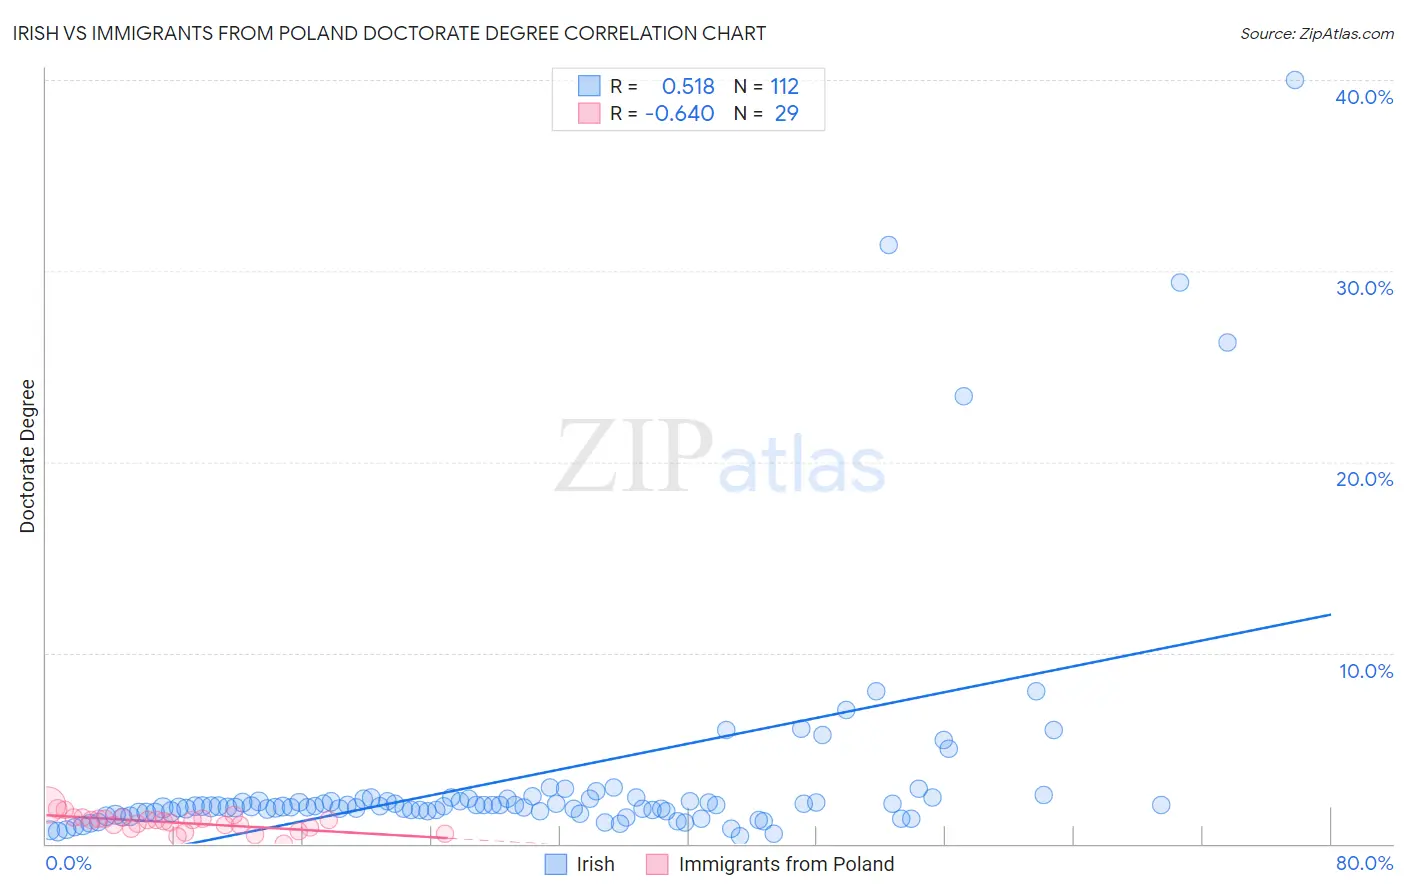
Irish vs Immigrants from Poland Doctorate Degree Correlation Chart
The statistical analysis conducted on geographies consisting of 550,861,641 people shows a substantial positive correlation between the proportion of Irish and percentage of population with at least doctorate degree education in the United States with a correlation coefficient (R) of 0.518 and weighted average of 1.9%. Similarly, the statistical analysis conducted on geographies consisting of 303,139,955 people shows a significant negative correlation between the proportion of Immigrants from Poland and percentage of population with at least doctorate degree education in the United States with a correlation coefficient (R) of -0.640 and weighted average of 1.7%, a difference of 13.1%.
Doctorate Degree Correlation Summary
| Measurement | Irish | Immigrants from Poland |
| Minimum | 0.38% | 0.013% |
| Maximum | 40.0% | 2.0% |
| Range | 39.6% | 2.0% |
| Mean | 3.4% | 1.1% |
| Median | 2.0% | 1.2% |
| Interquartile 25% (IQ1) | 1.7% | 0.83% |
| Interquartile 75% (IQ3) | 2.3% | 1.4% |
| Interquartile Range (IQR) | 0.66% | 0.53% |
| Standard Deviation (Sample) | 6.1% | 0.44% |
| Standard Deviation (Population) | 6.0% | 0.44% |
Similar Demographics by Doctorate Degree
Demographics Similar to Irish by Doctorate Degree
In terms of doctorate degree, the demographic groups most similar to Irish are Czech (1.9%, a difference of 0.040%), Celtic (1.9%, a difference of 0.13%), Immigrants from Middle Africa (1.9%, a difference of 0.21%), Welsh (1.9%, a difference of 0.36%), and Slovene (1.9%, a difference of 0.45%).
| Demographics | Rating | Rank | Doctorate Degree |
| Poles | 72.7 /100 | #155 | Good 1.9% |
| Slavs | 72.4 /100 | #156 | Good 1.9% |
| Danes | 71.9 /100 | #157 | Good 1.9% |
| Hungarians | 71.7 /100 | #158 | Good 1.9% |
| Slovenes | 70.2 /100 | #159 | Good 1.9% |
| Welsh | 69.7 /100 | #160 | Good 1.9% |
| Immigrants | Middle Africa | 68.8 /100 | #161 | Good 1.9% |
| Irish | 67.5 /100 | #162 | Good 1.9% |
| Czechs | 67.3 /100 | #163 | Good 1.9% |
| Celtics | 66.7 /100 | #164 | Good 1.9% |
| Scotch-Irish | 63.6 /100 | #165 | Good 1.9% |
| Spaniards | 63.5 /100 | #166 | Good 1.9% |
| Macedonians | 60.9 /100 | #167 | Good 1.9% |
| Sri Lankans | 60.3 /100 | #168 | Good 1.9% |
| Vietnamese | 54.8 /100 | #169 | Average 1.9% |
Demographics Similar to Immigrants from Poland by Doctorate Degree
In terms of doctorate degree, the demographic groups most similar to Immigrants from Poland are Immigrants from Bosnia and Herzegovina (1.7%, a difference of 0.22%), Immigrants from Colombia (1.7%, a difference of 0.49%), Osage (1.7%, a difference of 0.61%), Immigrants from Venezuela (1.7%, a difference of 0.68%), and Nonimmigrants (1.7%, a difference of 0.75%).
| Demographics | Rating | Rank | Doctorate Degree |
| Spanish Americans | 12.9 /100 | #217 | Poor 1.7% |
| Tlingit-Haida | 11.9 /100 | #218 | Poor 1.7% |
| Immigrants | Iraq | 10.7 /100 | #219 | Poor 1.7% |
| Immigrants | Uruguay | 9.2 /100 | #220 | Tragic 1.7% |
| Immigrants | Nonimmigrants | 8.8 /100 | #221 | Tragic 1.7% |
| Immigrants | Venezuela | 8.7 /100 | #222 | Tragic 1.7% |
| Immigrants | Bosnia and Herzegovina | 7.8 /100 | #223 | Tragic 1.7% |
| Immigrants | Poland | 7.4 /100 | #224 | Tragic 1.7% |
| Immigrants | Colombia | 6.7 /100 | #225 | Tragic 1.7% |
| Osage | 6.5 /100 | #226 | Tragic 1.7% |
| Panamanians | 6.3 /100 | #227 | Tragic 1.7% |
| Assyrians/Chaldeans/Syriacs | 5.9 /100 | #228 | Tragic 1.7% |
| Colville | 4.7 /100 | #229 | Tragic 1.6% |
| Immigrants | Philippines | 4.3 /100 | #230 | Tragic 1.6% |
| Immigrants | North Macedonia | 3.9 /100 | #231 | Tragic 1.6% |