Irish vs Hispanic or Latino Ambulatory Disability
COMPARE
Irish
Hispanic or Latino
Ambulatory Disability
Ambulatory Disability Comparison
Irish
Hispanics or Latinos
6.6%
AMBULATORY DISABILITY
0.4/ 100
METRIC RATING
261st/ 347
METRIC RANK
6.4%
AMBULATORY DISABILITY
2.2/ 100
METRIC RATING
235th/ 347
METRIC RANK
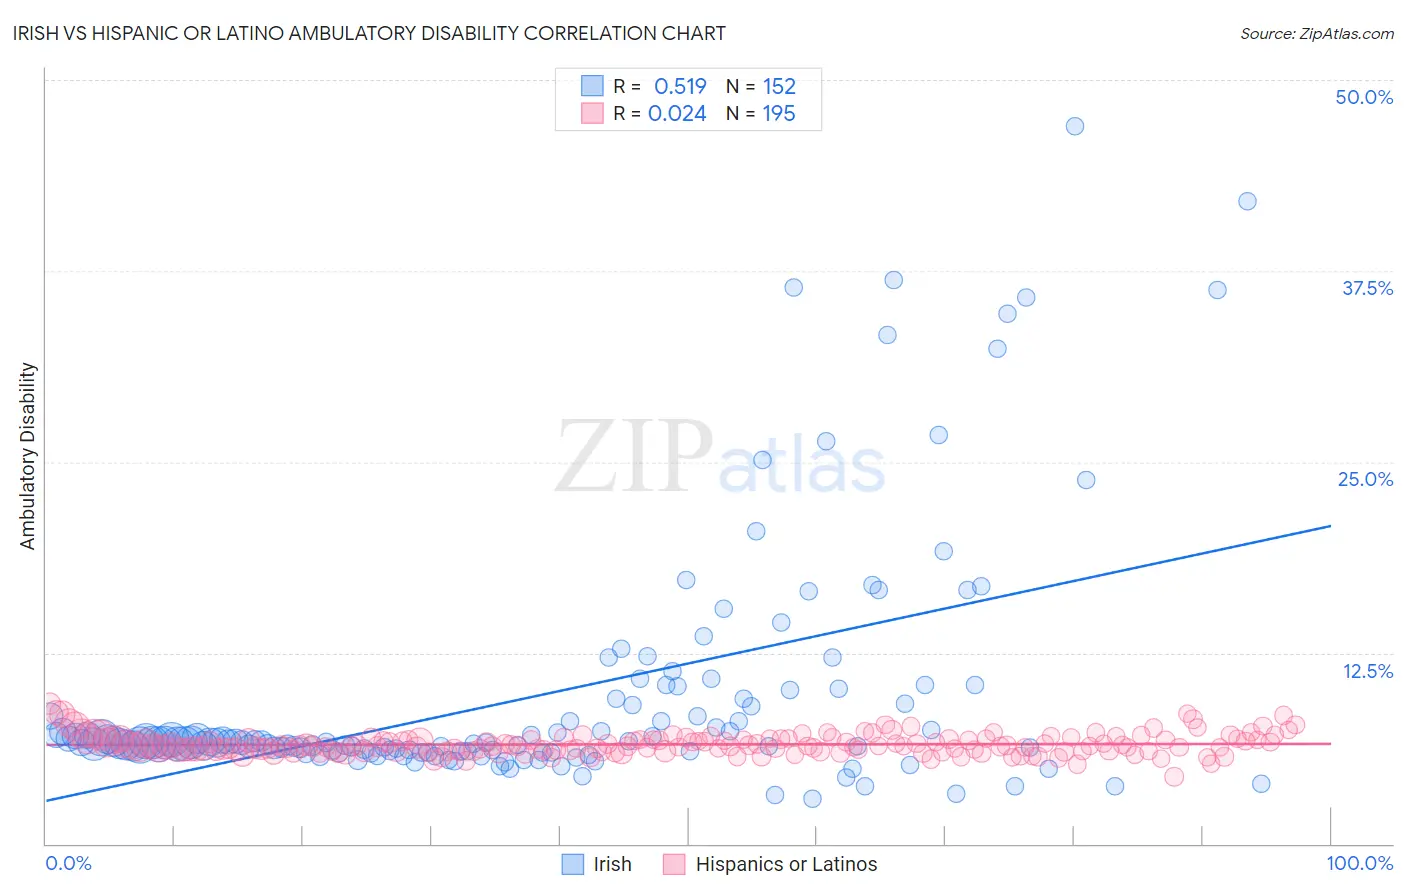
Irish vs Hispanic or Latino Ambulatory Disability Correlation Chart
The statistical analysis conducted on geographies consisting of 579,881,456 people shows a substantial positive correlation between the proportion of Irish and percentage of population with ambulatory disability in the United States with a correlation coefficient (R) of 0.519 and weighted average of 6.6%. Similarly, the statistical analysis conducted on geographies consisting of 572,469,194 people shows no correlation between the proportion of Hispanics or Latinos and percentage of population with ambulatory disability in the United States with a correlation coefficient (R) of 0.024 and weighted average of 6.4%, a difference of 2.1%.
Ambulatory Disability Correlation Summary
| Measurement | Irish | Hispanic or Latino |
| Minimum | 3.0% | 4.4% |
| Maximum | 47.0% | 9.2% |
| Range | 44.0% | 4.8% |
| Mean | 9.8% | 6.5% |
| Median | 6.6% | 6.4% |
| Interquartile 25% (IQ1) | 6.1% | 6.1% |
| Interquartile 75% (IQ3) | 9.5% | 6.8% |
| Interquartile Range (IQR) | 3.4% | 0.75% |
| Standard Deviation (Sample) | 8.2% | 0.65% |
| Standard Deviation (Population) | 8.1% | 0.65% |
Similar Demographics by Ambulatory Disability
Demographics Similar to Irish by Ambulatory Disability
In terms of ambulatory disability, the demographic groups most similar to Irish are Immigrants from Belize (6.6%, a difference of 0.070%), Aleut (6.6%, a difference of 0.080%), English (6.6%, a difference of 0.17%), Spanish American Indian (6.5%, a difference of 0.26%), and Hmong (6.6%, a difference of 0.29%).
| Demographics | Rating | Rank | Ambulatory Disability |
| Belizeans | 0.7 /100 | #254 | Tragic 6.5% |
| Welsh | 0.6 /100 | #255 | Tragic 6.5% |
| Immigrants | Uzbekistan | 0.6 /100 | #256 | Tragic 6.5% |
| Bermudans | 0.5 /100 | #257 | Tragic 6.5% |
| Spanish American Indians | 0.5 /100 | #258 | Tragic 6.5% |
| Aleuts | 0.4 /100 | #259 | Tragic 6.6% |
| Immigrants | Belize | 0.4 /100 | #260 | Tragic 6.6% |
| Irish | 0.4 /100 | #261 | Tragic 6.6% |
| English | 0.4 /100 | #262 | Tragic 6.6% |
| Hmong | 0.3 /100 | #263 | Tragic 6.6% |
| Nepalese | 0.2 /100 | #264 | Tragic 6.6% |
| Bahamians | 0.2 /100 | #265 | Tragic 6.6% |
| Guyanese | 0.2 /100 | #266 | Tragic 6.6% |
| Trinidadians and Tobagonians | 0.2 /100 | #267 | Tragic 6.6% |
| Spanish | 0.2 /100 | #268 | Tragic 6.6% |
Demographics Similar to Hispanics or Latinos by Ambulatory Disability
In terms of ambulatory disability, the demographic groups most similar to Hispanics or Latinos are Immigrants from Liberia (6.4%, a difference of 0.030%), Subsaharan African (6.4%, a difference of 0.060%), Assyrian/Chaldean/Syriac (6.4%, a difference of 0.12%), Dutch (6.4%, a difference of 0.15%), and Immigrants from Germany (6.4%, a difference of 0.24%).
| Demographics | Rating | Rank | Ambulatory Disability |
| Portuguese | 4.0 /100 | #228 | Tragic 6.4% |
| Czechoslovakians | 3.8 /100 | #229 | Tragic 6.4% |
| Mexicans | 3.5 /100 | #230 | Tragic 6.4% |
| Panamanians | 3.1 /100 | #231 | Tragic 6.4% |
| Assyrians/Chaldeans/Syriacs | 2.4 /100 | #232 | Tragic 6.4% |
| Sub-Saharan Africans | 2.3 /100 | #233 | Tragic 6.4% |
| Immigrants | Liberia | 2.3 /100 | #234 | Tragic 6.4% |
| Hispanics or Latinos | 2.2 /100 | #235 | Tragic 6.4% |
| Dutch | 2.0 /100 | #236 | Tragic 6.4% |
| Immigrants | Germany | 1.8 /100 | #237 | Tragic 6.4% |
| Haitians | 1.8 /100 | #238 | Tragic 6.4% |
| Senegalese | 1.7 /100 | #239 | Tragic 6.4% |
| Immigrants | Senegal | 1.7 /100 | #240 | Tragic 6.4% |
| Immigrants | Haiti | 1.6 /100 | #241 | Tragic 6.5% |
| Spaniards | 1.6 /100 | #242 | Tragic 6.5% |