Irish vs Peruvian Ambulatory Disability
COMPARE
Irish
Peruvian
Ambulatory Disability
Ambulatory Disability Comparison
Irish
Peruvians
6.6%
AMBULATORY DISABILITY
0.4/ 100
METRIC RATING
261st/ 347
METRIC RANK
5.7%
AMBULATORY DISABILITY
99.5/ 100
METRIC RATING
69th/ 347
METRIC RANK
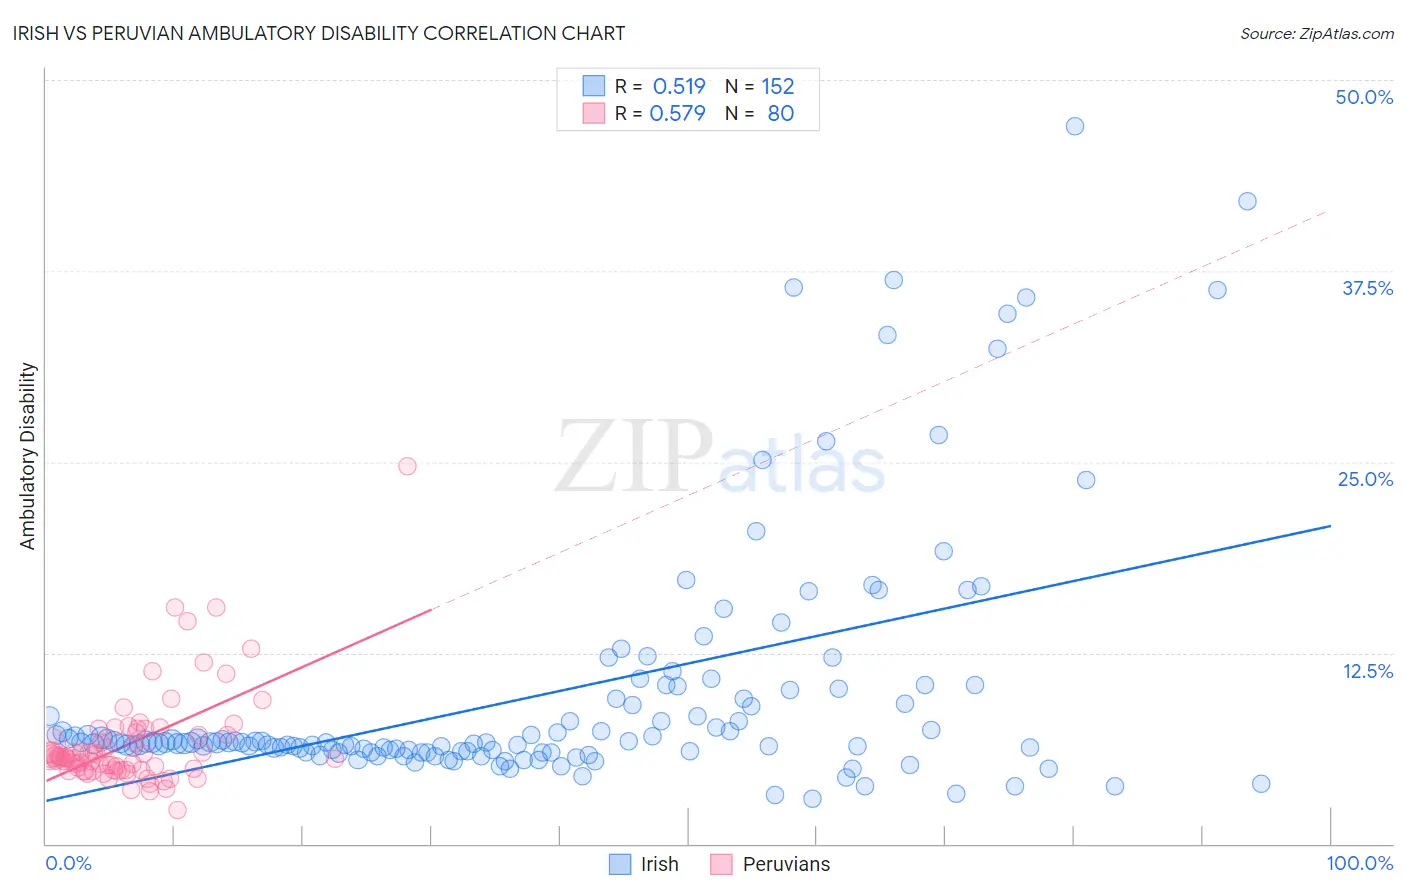
Irish vs Peruvian Ambulatory Disability Correlation Chart
The statistical analysis conducted on geographies consisting of 579,881,456 people shows a substantial positive correlation between the proportion of Irish and percentage of population with ambulatory disability in the United States with a correlation coefficient (R) of 0.519 and weighted average of 6.6%. Similarly, the statistical analysis conducted on geographies consisting of 363,114,873 people shows a substantial positive correlation between the proportion of Peruvians and percentage of population with ambulatory disability in the United States with a correlation coefficient (R) of 0.579 and weighted average of 5.7%, a difference of 15.4%.
Ambulatory Disability Correlation Summary
| Measurement | Irish | Peruvian |
| Minimum | 3.0% | 2.2% |
| Maximum | 47.0% | 24.7% |
| Range | 44.0% | 22.5% |
| Mean | 9.8% | 6.6% |
| Median | 6.6% | 5.7% |
| Interquartile 25% (IQ1) | 6.1% | 4.8% |
| Interquartile 75% (IQ3) | 9.5% | 7.2% |
| Interquartile Range (IQR) | 3.4% | 2.4% |
| Standard Deviation (Sample) | 8.2% | 3.3% |
| Standard Deviation (Population) | 8.1% | 3.3% |
Similar Demographics by Ambulatory Disability
Demographics Similar to Irish by Ambulatory Disability
In terms of ambulatory disability, the demographic groups most similar to Irish are Immigrants from Belize (6.6%, a difference of 0.070%), Aleut (6.6%, a difference of 0.080%), English (6.6%, a difference of 0.17%), Spanish American Indian (6.5%, a difference of 0.26%), and Hmong (6.6%, a difference of 0.29%).
| Demographics | Rating | Rank | Ambulatory Disability |
| Belizeans | 0.7 /100 | #254 | Tragic 6.5% |
| Welsh | 0.6 /100 | #255 | Tragic 6.5% |
| Immigrants | Uzbekistan | 0.6 /100 | #256 | Tragic 6.5% |
| Bermudans | 0.5 /100 | #257 | Tragic 6.5% |
| Spanish American Indians | 0.5 /100 | #258 | Tragic 6.5% |
| Aleuts | 0.4 /100 | #259 | Tragic 6.6% |
| Immigrants | Belize | 0.4 /100 | #260 | Tragic 6.6% |
| Irish | 0.4 /100 | #261 | Tragic 6.6% |
| English | 0.4 /100 | #262 | Tragic 6.6% |
| Hmong | 0.3 /100 | #263 | Tragic 6.6% |
| Nepalese | 0.2 /100 | #264 | Tragic 6.6% |
| Bahamians | 0.2 /100 | #265 | Tragic 6.6% |
| Guyanese | 0.2 /100 | #266 | Tragic 6.6% |
| Trinidadians and Tobagonians | 0.2 /100 | #267 | Tragic 6.6% |
| Spanish | 0.2 /100 | #268 | Tragic 6.6% |
Demographics Similar to Peruvians by Ambulatory Disability
In terms of ambulatory disability, the demographic groups most similar to Peruvians are Sierra Leonean (5.7%, a difference of 0.23%), Immigrants from Peru (5.7%, a difference of 0.32%), Brazilian (5.7%, a difference of 0.34%), Immigrants from Northern Africa (5.7%, a difference of 0.36%), and Immigrants from Cameroon (5.7%, a difference of 0.36%).
| Demographics | Rating | Rank | Ambulatory Disability |
| Immigrants | Spain | 99.7 /100 | #62 | Exceptional 5.6% |
| Immigrants | France | 99.7 /100 | #63 | Exceptional 5.6% |
| Laotians | 99.7 /100 | #64 | Exceptional 5.7% |
| Immigrants | Switzerland | 99.7 /100 | #65 | Exceptional 5.7% |
| Israelis | 99.6 /100 | #66 | Exceptional 5.7% |
| Immigrants | Uganda | 99.6 /100 | #67 | Exceptional 5.7% |
| Sri Lankans | 99.6 /100 | #68 | Exceptional 5.7% |
| Peruvians | 99.5 /100 | #69 | Exceptional 5.7% |
| Sierra Leoneans | 99.4 /100 | #70 | Exceptional 5.7% |
| Immigrants | Peru | 99.4 /100 | #71 | Exceptional 5.7% |
| Brazilians | 99.4 /100 | #72 | Exceptional 5.7% |
| Immigrants | Northern Africa | 99.4 /100 | #73 | Exceptional 5.7% |
| Immigrants | Cameroon | 99.4 /100 | #74 | Exceptional 5.7% |
| Immigrants | South Africa | 99.3 /100 | #75 | Exceptional 5.7% |
| Sudanese | 99.3 /100 | #76 | Exceptional 5.7% |