Irish vs Immigrants from West Indies Ambulatory Disability
COMPARE
Irish
Immigrants from West Indies
Ambulatory Disability
Ambulatory Disability Comparison
Irish
Immigrants from West Indies
6.6%
AMBULATORY DISABILITY
0.4/ 100
METRIC RATING
261st/ 347
METRIC RANK
6.7%
AMBULATORY DISABILITY
0.1/ 100
METRIC RATING
278th/ 347
METRIC RANK
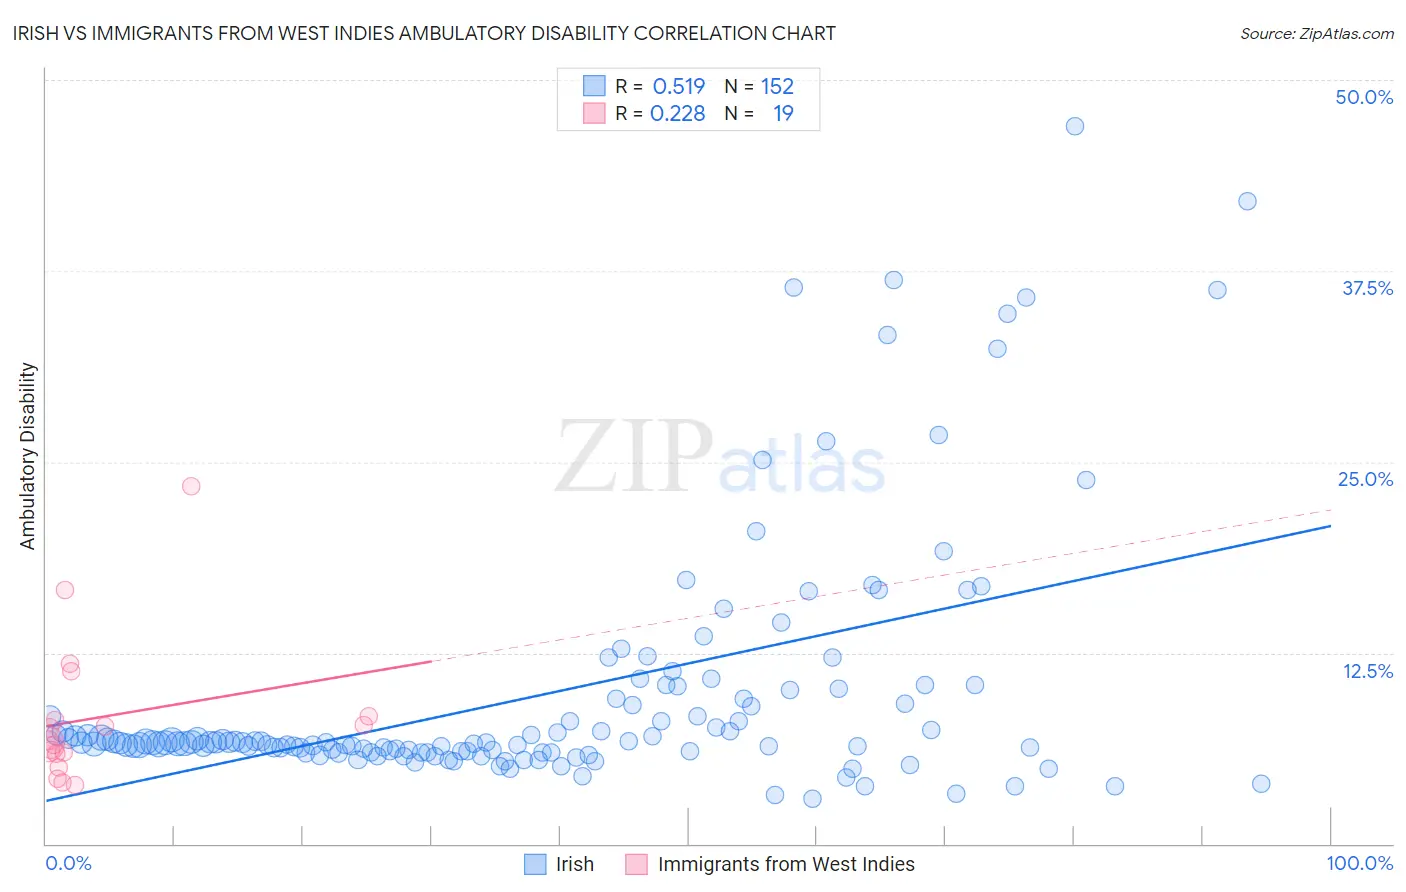
Irish vs Immigrants from West Indies Ambulatory Disability Correlation Chart
The statistical analysis conducted on geographies consisting of 579,881,456 people shows a substantial positive correlation between the proportion of Irish and percentage of population with ambulatory disability in the United States with a correlation coefficient (R) of 0.519 and weighted average of 6.6%. Similarly, the statistical analysis conducted on geographies consisting of 72,456,461 people shows a weak positive correlation between the proportion of Immigrants from West Indies and percentage of population with ambulatory disability in the United States with a correlation coefficient (R) of 0.228 and weighted average of 6.7%, a difference of 2.5%.
Ambulatory Disability Correlation Summary
| Measurement | Irish | Immigrants from West Indies |
| Minimum | 3.0% | 3.8% |
| Maximum | 47.0% | 23.4% |
| Range | 44.0% | 19.6% |
| Mean | 9.8% | 8.3% |
| Median | 6.6% | 6.8% |
| Interquartile 25% (IQ1) | 6.1% | 5.9% |
| Interquartile 75% (IQ3) | 9.5% | 8.3% |
| Interquartile Range (IQR) | 3.4% | 2.4% |
| Standard Deviation (Sample) | 8.2% | 4.8% |
| Standard Deviation (Population) | 8.1% | 4.7% |
Demographics Similar to Irish and Immigrants from West Indies by Ambulatory Disability
In terms of ambulatory disability, the demographic groups most similar to Irish are Immigrants from Belize (6.6%, a difference of 0.070%), Aleut (6.6%, a difference of 0.080%), English (6.6%, a difference of 0.17%), Hmong (6.6%, a difference of 0.29%), and Nepalese (6.6%, a difference of 0.69%). Similarly, the demographic groups most similar to Immigrants from West Indies are Jamaican (6.7%, a difference of 0.080%), Celtic (6.7%, a difference of 0.15%), Immigrants from Guyana (6.7%, a difference of 0.18%), Sioux (6.7%, a difference of 0.25%), and Immigrants from Caribbean (6.7%, a difference of 0.31%).
| Demographics | Rating | Rank | Ambulatory Disability |
| Aleuts | 0.4 /100 | #259 | Tragic 6.6% |
| Immigrants | Belize | 0.4 /100 | #260 | Tragic 6.6% |
| Irish | 0.4 /100 | #261 | Tragic 6.6% |
| English | 0.4 /100 | #262 | Tragic 6.6% |
| Hmong | 0.3 /100 | #263 | Tragic 6.6% |
| Nepalese | 0.2 /100 | #264 | Tragic 6.6% |
| Bahamians | 0.2 /100 | #265 | Tragic 6.6% |
| Guyanese | 0.2 /100 | #266 | Tragic 6.6% |
| Trinidadians and Tobagonians | 0.2 /100 | #267 | Tragic 6.6% |
| Spanish | 0.2 /100 | #268 | Tragic 6.6% |
| French | 0.1 /100 | #269 | Tragic 6.6% |
| Slovaks | 0.1 /100 | #270 | Tragic 6.7% |
| Immigrants | Trinidad and Tobago | 0.1 /100 | #271 | Tragic 6.7% |
| French Canadians | 0.1 /100 | #272 | Tragic 6.7% |
| Whites/Caucasians | 0.1 /100 | #273 | Tragic 6.7% |
| Sioux | 0.1 /100 | #274 | Tragic 6.7% |
| Immigrants | Guyana | 0.1 /100 | #275 | Tragic 6.7% |
| Celtics | 0.1 /100 | #276 | Tragic 6.7% |
| Jamaicans | 0.1 /100 | #277 | Tragic 6.7% |
| Immigrants | West Indies | 0.1 /100 | #278 | Tragic 6.7% |
| Immigrants | Caribbean | 0.0 /100 | #279 | Tragic 6.7% |