Irish vs Honduran Female Poverty Among 25-34 Year Olds
COMPARE
Irish
Honduran
Female Poverty Among 25-34 Year Olds
Female Poverty Among 25-34 Year Olds Comparison
Irish
Hondurans
13.7%
FEMALE POVERTY AMONG 25-34 YEAR OLDS
35.3/ 100
METRIC RATING
185th/ 347
METRIC RANK
16.9%
FEMALE POVERTY AMONG 25-34 YEAR OLDS
0.0/ 100
METRIC RATING
304th/ 347
METRIC RANK
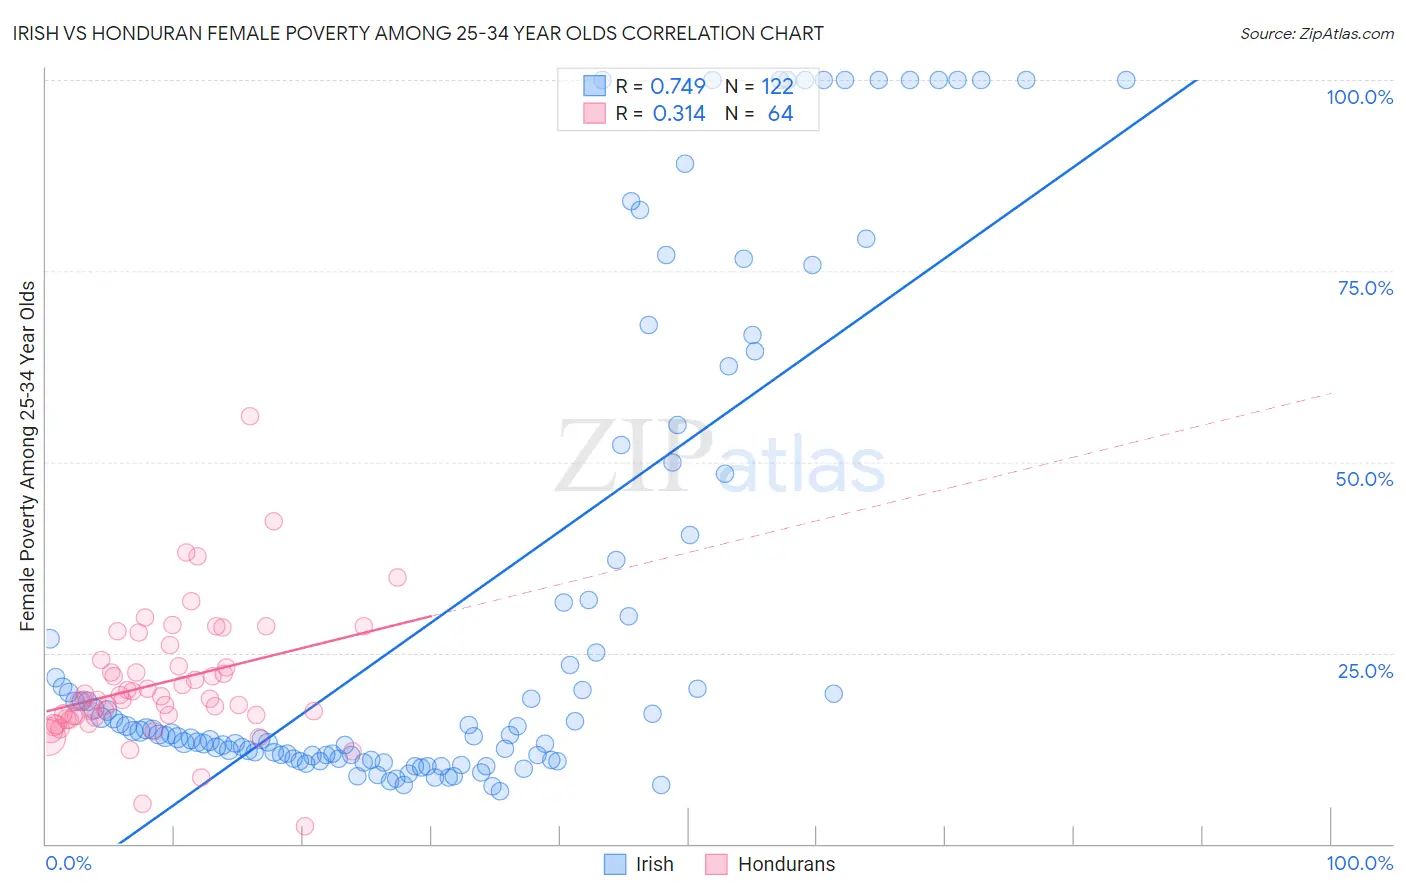
Irish vs Honduran Female Poverty Among 25-34 Year Olds Correlation Chart
The statistical analysis conducted on geographies consisting of 555,342,984 people shows a strong positive correlation between the proportion of Irish and poverty level among females between the ages 25 and 34 in the United States with a correlation coefficient (R) of 0.749 and weighted average of 13.7%. Similarly, the statistical analysis conducted on geographies consisting of 354,770,932 people shows a mild positive correlation between the proportion of Hondurans and poverty level among females between the ages 25 and 34 in the United States with a correlation coefficient (R) of 0.314 and weighted average of 16.9%, a difference of 23.2%.
Female Poverty Among 25-34 Year Olds Correlation Summary
| Measurement | Irish | Honduran |
| Minimum | 6.8% | 2.2% |
| Maximum | 100.0% | 56.0% |
| Range | 93.2% | 53.7% |
| Mean | 31.0% | 21.1% |
| Median | 14.6% | 18.9% |
| Interquartile 25% (IQ1) | 11.5% | 16.6% |
| Interquartile 75% (IQ3) | 37.1% | 23.7% |
| Interquartile Range (IQR) | 25.6% | 7.1% |
| Standard Deviation (Sample) | 31.4% | 8.5% |
| Standard Deviation (Population) | 31.3% | 8.4% |
Similar Demographics by Female Poverty Among 25-34 Year Olds
Demographics Similar to Irish by Female Poverty Among 25-34 Year Olds
In terms of female poverty among 25-34 year olds, the demographic groups most similar to Irish are Immigrants from Uruguay (13.7%, a difference of 0.11%), Slovak (13.7%, a difference of 0.11%), Czechoslovakian (13.7%, a difference of 0.13%), Immigrants from Eritrea (13.7%, a difference of 0.24%), and Finnish (13.7%, a difference of 0.26%).
| Demographics | Rating | Rank | Female Poverty Among 25-34 Year Olds |
| Canadians | 44.3 /100 | #178 | Average 13.6% |
| Immigrants | Eastern Africa | 43.6 /100 | #179 | Average 13.6% |
| Germans | 41.6 /100 | #180 | Average 13.6% |
| Guamanians/Chamorros | 41.5 /100 | #181 | Average 13.6% |
| Immigrants | Venezuela | 40.7 /100 | #182 | Average 13.6% |
| Portuguese | 40.3 /100 | #183 | Average 13.6% |
| Czechoslovakians | 36.8 /100 | #184 | Fair 13.7% |
| Irish | 35.3 /100 | #185 | Fair 13.7% |
| Immigrants | Uruguay | 34.1 /100 | #186 | Fair 13.7% |
| Slovaks | 34.1 /100 | #187 | Fair 13.7% |
| Immigrants | Eritrea | 32.7 /100 | #188 | Fair 13.7% |
| Finns | 32.5 /100 | #189 | Fair 13.7% |
| Dutch | 29.7 /100 | #190 | Fair 13.8% |
| Immigrants | St. Vincent and the Grenadines | 29.3 /100 | #191 | Fair 13.8% |
| Tlingit-Haida | 28.1 /100 | #192 | Fair 13.8% |
Demographics Similar to Hondurans by Female Poverty Among 25-34 Year Olds
In terms of female poverty among 25-34 year olds, the demographic groups most similar to Hondurans are Immigrants from Cabo Verde (16.9%, a difference of 0.17%), Immigrants from Mexico (16.8%, a difference of 0.42%), Alaska Native (16.8%, a difference of 0.73%), Chickasaw (17.0%, a difference of 0.75%), and Yaqui (17.0%, a difference of 0.76%).
| Demographics | Rating | Rank | Female Poverty Among 25-34 Year Olds |
| Immigrants | Guatemala | 0.0 /100 | #297 | Tragic 16.6% |
| Blackfeet | 0.0 /100 | #298 | Tragic 16.7% |
| Spanish Americans | 0.0 /100 | #299 | Tragic 16.7% |
| U.S. Virgin Islanders | 0.0 /100 | #300 | Tragic 16.7% |
| Immigrants | Congo | 0.0 /100 | #301 | Tragic 16.7% |
| Alaska Natives | 0.0 /100 | #302 | Tragic 16.8% |
| Immigrants | Mexico | 0.0 /100 | #303 | Tragic 16.8% |
| Hondurans | 0.0 /100 | #304 | Tragic 16.9% |
| Immigrants | Cabo Verde | 0.0 /100 | #305 | Tragic 16.9% |
| Chickasaw | 0.0 /100 | #306 | Tragic 17.0% |
| Yaqui | 0.0 /100 | #307 | Tragic 17.0% |
| Africans | 0.0 /100 | #308 | Tragic 17.0% |
| Ottawa | 0.0 /100 | #309 | Tragic 17.1% |
| Cherokee | 0.0 /100 | #310 | Tragic 17.2% |
| Immigrants | Honduras | 0.0 /100 | #311 | Tragic 17.3% |