Iraqi vs Romanian Self-Care Disability
COMPARE
Iraqi
Romanian
Self-Care Disability
Self-Care Disability Comparison
Iraqis
Romanians
2.6%
SELF-CARE DISABILITY
3.2/ 100
METRIC RATING
225th/ 347
METRIC RANK
2.4%
SELF-CARE DISABILITY
75.8/ 100
METRIC RATING
148th/ 347
METRIC RANK
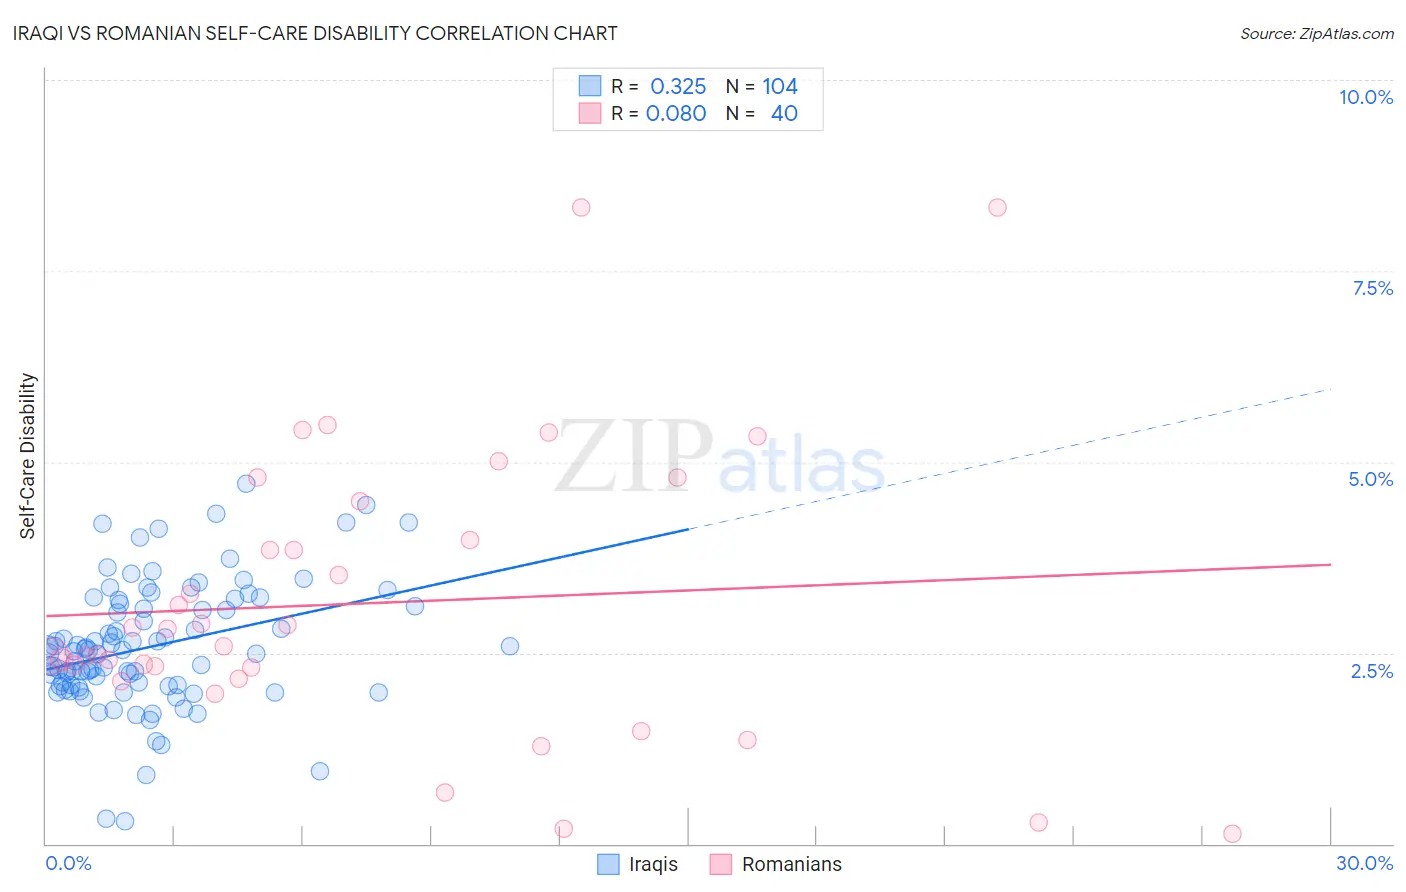
Iraqi vs Romanian Self-Care Disability Correlation Chart
The statistical analysis conducted on geographies consisting of 170,619,195 people shows a mild positive correlation between the proportion of Iraqis and percentage of population with self-care disability in the United States with a correlation coefficient (R) of 0.325 and weighted average of 2.6%. Similarly, the statistical analysis conducted on geographies consisting of 377,466,974 people shows a slight positive correlation between the proportion of Romanians and percentage of population with self-care disability in the United States with a correlation coefficient (R) of 0.080 and weighted average of 2.4%, a difference of 5.5%.
Self-Care Disability Correlation Summary
| Measurement | Iraqi | Romanian |
| Minimum | 0.30% | 0.12% |
| Maximum | 4.7% | 8.3% |
| Range | 4.4% | 8.2% |
| Mean | 2.6% | 3.2% |
| Median | 2.5% | 2.7% |
| Interquartile 25% (IQ1) | 2.1% | 2.2% |
| Interquartile 75% (IQ3) | 3.1% | 4.2% |
| Interquartile Range (IQR) | 1.1% | 2.0% |
| Standard Deviation (Sample) | 0.81% | 1.9% |
| Standard Deviation (Population) | 0.81% | 1.9% |
Similar Demographics by Self-Care Disability
Demographics Similar to Iraqis by Self-Care Disability
In terms of self-care disability, the demographic groups most similar to Iraqis are Chinese (2.6%, a difference of 0.10%), Osage (2.6%, a difference of 0.16%), Immigrants from Philippines (2.6%, a difference of 0.18%), Guatemalan (2.6%, a difference of 0.19%), and Spaniard (2.6%, a difference of 0.22%).
| Demographics | Rating | Rank | Self-Care Disability |
| Scotch-Irish | 4.1 /100 | #218 | Tragic 2.6% |
| Immigrants | Moldova | 4.0 /100 | #219 | Tragic 2.6% |
| Sub-Saharan Africans | 4.0 /100 | #220 | Tragic 2.6% |
| Hondurans | 3.8 /100 | #221 | Tragic 2.6% |
| Spaniards | 3.8 /100 | #222 | Tragic 2.6% |
| French Canadians | 3.8 /100 | #223 | Tragic 2.6% |
| Osage | 3.6 /100 | #224 | Tragic 2.6% |
| Iraqis | 3.2 /100 | #225 | Tragic 2.6% |
| Chinese | 2.9 /100 | #226 | Tragic 2.6% |
| Immigrants | Philippines | 2.7 /100 | #227 | Tragic 2.6% |
| Guatemalans | 2.7 /100 | #228 | Tragic 2.6% |
| Guamanians/Chamorros | 2.5 /100 | #229 | Tragic 2.6% |
| Immigrants | Ecuador | 2.5 /100 | #230 | Tragic 2.6% |
| Immigrants | Guatemala | 2.2 /100 | #231 | Tragic 2.6% |
| Albanians | 2.2 /100 | #232 | Tragic 2.6% |
Demographics Similar to Romanians by Self-Care Disability
In terms of self-care disability, the demographic groups most similar to Romanians are Arab (2.4%, a difference of 0.010%), Immigrants from Costa Rica (2.4%, a difference of 0.050%), Dutch (2.4%, a difference of 0.11%), Basque (2.4%, a difference of 0.12%), and Tlingit-Haida (2.4%, a difference of 0.15%).
| Demographics | Rating | Rank | Self-Care Disability |
| Alaska Natives | 84.5 /100 | #141 | Excellent 2.4% |
| Immigrants | Peru | 83.2 /100 | #142 | Excellent 2.4% |
| Afghans | 82.3 /100 | #143 | Excellent 2.4% |
| Costa Ricans | 80.8 /100 | #144 | Excellent 2.4% |
| Germans | 80.1 /100 | #145 | Excellent 2.4% |
| Israelis | 80.0 /100 | #146 | Good 2.4% |
| Dutch | 77.5 /100 | #147 | Good 2.4% |
| Romanians | 75.8 /100 | #148 | Good 2.4% |
| Arabs | 75.7 /100 | #149 | Good 2.4% |
| Immigrants | Costa Rica | 75.1 /100 | #150 | Good 2.4% |
| Basques | 74.0 /100 | #151 | Good 2.4% |
| Tlingit-Haida | 73.5 /100 | #152 | Good 2.4% |
| Immigrants | England | 73.5 /100 | #153 | Good 2.4% |
| Italians | 72.2 /100 | #154 | Good 2.4% |
| Pakistanis | 71.4 /100 | #155 | Good 2.4% |