Iraqi vs Romanian Family Poverty
COMPARE
Iraqi
Romanian
Family Poverty
Family Poverty Comparison
Iraqis
Romanians
9.3%
FAMILY POVERTY
24.2/ 100
METRIC RATING
198th/ 347
METRIC RANK
8.2%
FAMILY POVERTY
94.7/ 100
METRIC RATING
110th/ 347
METRIC RANK
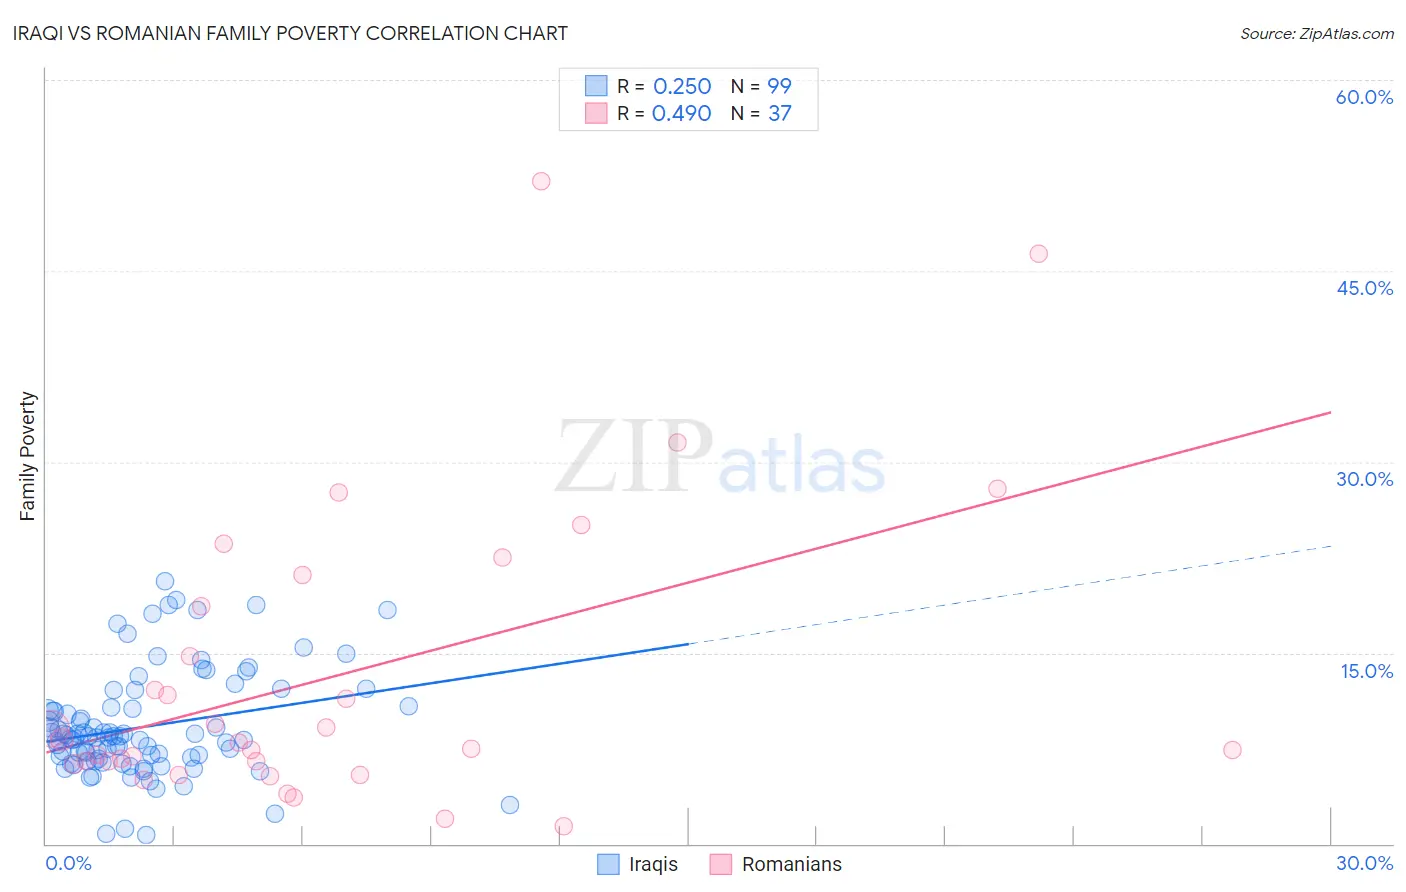
Iraqi vs Romanian Family Poverty Correlation Chart
The statistical analysis conducted on geographies consisting of 170,433,754 people shows a weak positive correlation between the proportion of Iraqis and poverty level among families in the United States with a correlation coefficient (R) of 0.250 and weighted average of 9.3%. Similarly, the statistical analysis conducted on geographies consisting of 376,889,400 people shows a moderate positive correlation between the proportion of Romanians and poverty level among families in the United States with a correlation coefficient (R) of 0.490 and weighted average of 8.2%, a difference of 14.5%.
Family Poverty Correlation Summary
| Measurement | Iraqi | Romanian |
| Minimum | 0.67% | 1.4% |
| Maximum | 20.6% | 52.0% |
| Range | 19.9% | 50.6% |
| Mean | 9.2% | 13.2% |
| Median | 8.4% | 7.9% |
| Interquartile 25% (IQ1) | 6.7% | 6.4% |
| Interquartile 75% (IQ3) | 10.7% | 19.9% |
| Interquartile Range (IQR) | 4.1% | 13.5% |
| Standard Deviation (Sample) | 4.1% | 11.8% |
| Standard Deviation (Population) | 4.1% | 11.6% |
Similar Demographics by Family Poverty
Demographics Similar to Iraqis by Family Poverty
In terms of family poverty, the demographic groups most similar to Iraqis are Immigrants from Colombia (9.3%, a difference of 0.030%), Spaniard (9.4%, a difference of 0.25%), Immigrants from Venezuela (9.3%, a difference of 0.32%), Immigrants from Costa Rica (9.4%, a difference of 0.44%), and Venezuelan (9.3%, a difference of 0.53%).
| Demographics | Rating | Rank | Family Poverty |
| Ugandans | 28.7 /100 | #191 | Fair 9.3% |
| Spanish | 28.7 /100 | #192 | Fair 9.3% |
| Immigrants | Western Asia | 28.2 /100 | #193 | Fair 9.3% |
| South Americans | 28.1 /100 | #194 | Fair 9.3% |
| Venezuelans | 27.4 /100 | #195 | Fair 9.3% |
| Immigrants | Venezuela | 26.1 /100 | #196 | Fair 9.3% |
| Immigrants | Colombia | 24.4 /100 | #197 | Fair 9.3% |
| Iraqis | 24.2 /100 | #198 | Fair 9.3% |
| Spaniards | 22.8 /100 | #199 | Fair 9.4% |
| Immigrants | Costa Rica | 21.7 /100 | #200 | Fair 9.4% |
| Immigrants | Portugal | 20.5 /100 | #201 | Fair 9.4% |
| Immigrants | Sierra Leone | 19.6 /100 | #202 | Poor 9.4% |
| German Russians | 19.4 /100 | #203 | Poor 9.4% |
| Immigrants | Lebanon | 18.9 /100 | #204 | Poor 9.4% |
| Aleuts | 18.0 /100 | #205 | Poor 9.5% |
Demographics Similar to Romanians by Family Poverty
In terms of family poverty, the demographic groups most similar to Romanians are Taiwanese (8.2%, a difference of 0.060%), Jordanian (8.2%, a difference of 0.090%), Immigrants from France (8.2%, a difference of 0.16%), Basque (8.1%, a difference of 0.18%), and French Canadian (8.1%, a difference of 0.27%).
| Demographics | Rating | Rank | Family Poverty |
| Immigrants | Eastern Europe | 95.6 /100 | #103 | Exceptional 8.1% |
| Slavs | 95.6 /100 | #104 | Exceptional 8.1% |
| Laotians | 95.6 /100 | #105 | Exceptional 8.1% |
| Egyptians | 95.1 /100 | #106 | Exceptional 8.1% |
| French Canadians | 95.0 /100 | #107 | Exceptional 8.1% |
| Basques | 94.9 /100 | #108 | Exceptional 8.1% |
| Jordanians | 94.8 /100 | #109 | Exceptional 8.2% |
| Romanians | 94.7 /100 | #110 | Exceptional 8.2% |
| Taiwanese | 94.6 /100 | #111 | Exceptional 8.2% |
| Immigrants | France | 94.4 /100 | #112 | Exceptional 8.2% |
| Canadians | 94.2 /100 | #113 | Exceptional 8.2% |
| Immigrants | Zimbabwe | 94.0 /100 | #114 | Exceptional 8.2% |
| Immigrants | Israel | 93.5 /100 | #115 | Exceptional 8.2% |
| South Africans | 93.4 /100 | #116 | Exceptional 8.2% |
| Immigrants | Russia | 93.2 /100 | #117 | Exceptional 8.2% |