Iranian vs Menominee In Labor Force | Age 30-34
COMPARE
Iranian
Menominee
In Labor Force | Age 30-34
In Labor Force | Age 30-34 Comparison
Iranians
Menominee
85.4%
IN LABOR FORCE | AGE 30-34
99.0/ 100
METRIC RATING
76th/ 347
METRIC RANK
82.2%
IN LABOR FORCE | AGE 30-34
0.0/ 100
METRIC RATING
307th/ 347
METRIC RANK
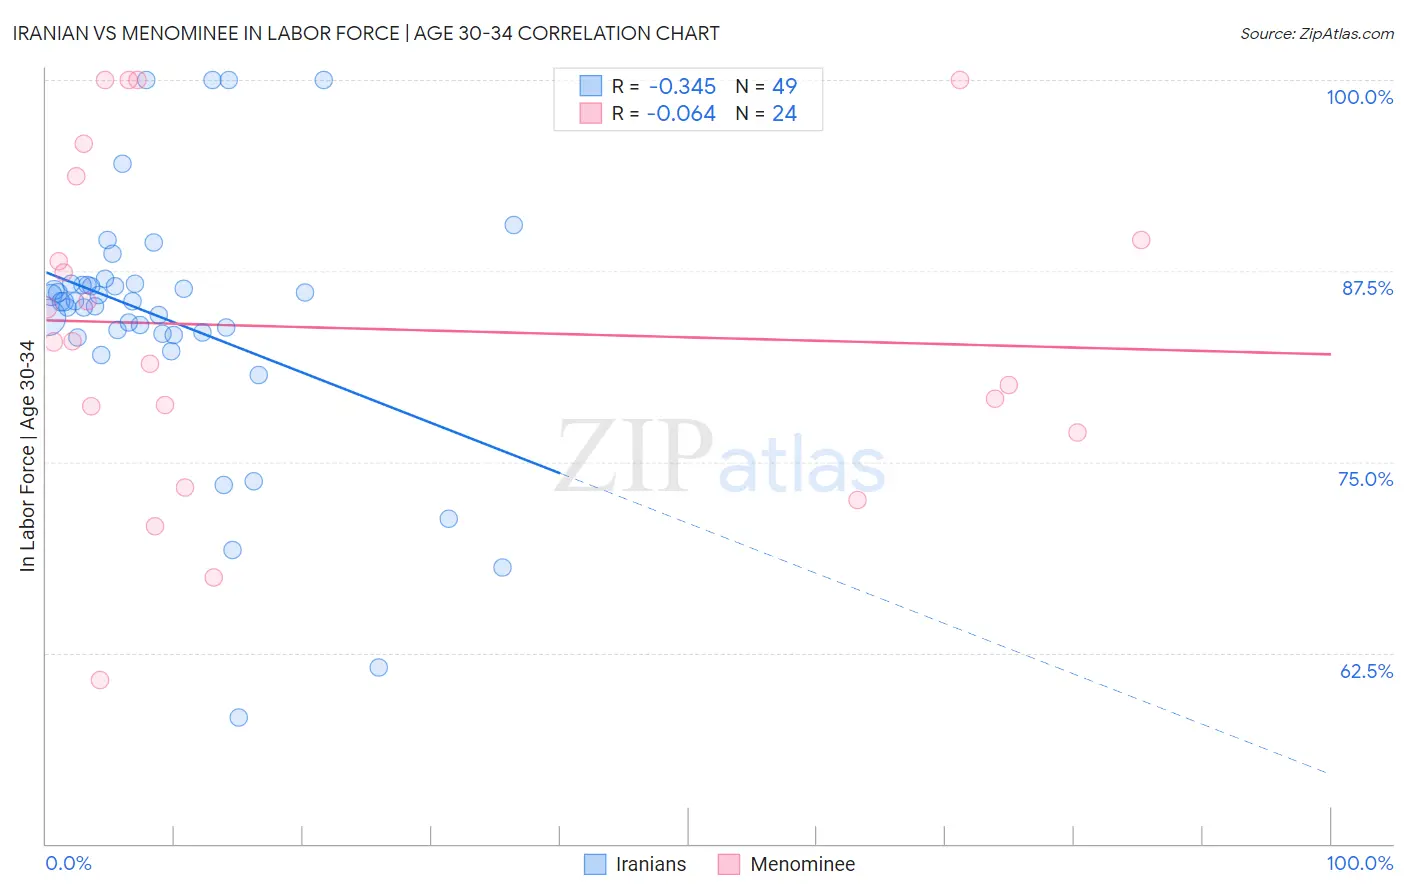
Iranian vs Menominee In Labor Force | Age 30-34 Correlation Chart
The statistical analysis conducted on geographies consisting of 316,667,155 people shows a mild negative correlation between the proportion of Iranians and labor force participation rate among population between the ages 30 and 34 in the United States with a correlation coefficient (R) of -0.345 and weighted average of 85.4%. Similarly, the statistical analysis conducted on geographies consisting of 45,774,457 people shows a slight negative correlation between the proportion of Menominee and labor force participation rate among population between the ages 30 and 34 in the United States with a correlation coefficient (R) of -0.064 and weighted average of 82.2%, a difference of 3.9%.
In Labor Force | Age 30-34 Correlation Summary
| Measurement | Iranian | Menominee |
| Minimum | 58.3% | 60.7% |
| Maximum | 100.0% | 100.0% |
| Range | 41.7% | 39.3% |
| Mean | 84.3% | 83.8% |
| Median | 85.5% | 82.9% |
| Interquartile 25% (IQ1) | 83.4% | 77.8% |
| Interquartile 75% (IQ3) | 86.6% | 91.6% |
| Interquartile Range (IQR) | 3.3% | 13.8% |
| Standard Deviation (Sample) | 8.4% | 10.9% |
| Standard Deviation (Population) | 8.3% | 10.6% |
Similar Demographics by In Labor Force | Age 30-34
Demographics Similar to Iranians by In Labor Force | Age 30-34
In terms of in labor force | age 30-34, the demographic groups most similar to Iranians are Immigrants from Czechoslovakia (85.4%, a difference of 0.0%), Immigrants from Japan (85.4%, a difference of 0.010%), Immigrants from China (85.4%, a difference of 0.010%), Indian (Asian) (85.4%, a difference of 0.010%), and Maltese (85.4%, a difference of 0.010%).
| Demographics | Rating | Rank | In Labor Force | Age 30-34 |
| Immigrants | Iran | 99.2 /100 | #69 | Exceptional 85.4% |
| Brazilians | 99.1 /100 | #70 | Exceptional 85.4% |
| Immigrants | Japan | 99.1 /100 | #71 | Exceptional 85.4% |
| Immigrants | China | 99.0 /100 | #72 | Exceptional 85.4% |
| Indians (Asian) | 99.0 /100 | #73 | Exceptional 85.4% |
| Maltese | 99.0 /100 | #74 | Exceptional 85.4% |
| Immigrants | Czechoslovakia | 99.0 /100 | #75 | Exceptional 85.4% |
| Iranians | 99.0 /100 | #76 | Exceptional 85.4% |
| Immigrants | Eastern Asia | 98.9 /100 | #77 | Exceptional 85.4% |
| Immigrants | Singapore | 98.8 /100 | #78 | Exceptional 85.3% |
| Immigrants | Switzerland | 98.7 /100 | #79 | Exceptional 85.3% |
| Immigrants | Russia | 98.7 /100 | #80 | Exceptional 85.3% |
| Slovaks | 98.7 /100 | #81 | Exceptional 85.3% |
| Immigrants | Africa | 98.6 /100 | #82 | Exceptional 85.3% |
| Immigrants | Europe | 98.6 /100 | #83 | Exceptional 85.3% |
Demographics Similar to Menominee by In Labor Force | Age 30-34
In terms of in labor force | age 30-34, the demographic groups most similar to Menominee are Spanish American Indian (82.2%, a difference of 0.060%), Osage (82.3%, a difference of 0.070%), Puget Sound Salish (82.1%, a difference of 0.10%), Tlingit-Haida (82.3%, a difference of 0.15%), and Immigrants from Micronesia (82.4%, a difference of 0.23%).
| Demographics | Rating | Rank | In Labor Force | Age 30-34 |
| Hmong | 0.0 /100 | #300 | Tragic 82.4% |
| Hispanics or Latinos | 0.0 /100 | #301 | Tragic 82.4% |
| Ottawa | 0.0 /100 | #302 | Tragic 82.4% |
| Immigrants | Micronesia | 0.0 /100 | #303 | Tragic 82.4% |
| Tlingit-Haida | 0.0 /100 | #304 | Tragic 82.3% |
| Osage | 0.0 /100 | #305 | Tragic 82.3% |
| Spanish American Indians | 0.0 /100 | #306 | Tragic 82.2% |
| Menominee | 0.0 /100 | #307 | Tragic 82.2% |
| Puget Sound Salish | 0.0 /100 | #308 | Tragic 82.1% |
| Immigrants | Mexico | 0.0 /100 | #309 | Tragic 82.0% |
| Cajuns | 0.0 /100 | #310 | Tragic 82.0% |
| Chickasaw | 0.0 /100 | #311 | Tragic 81.9% |
| Mexicans | 0.0 /100 | #312 | Tragic 81.9% |
| Iroquois | 0.0 /100 | #313 | Tragic 81.9% |
| Alaskan Athabascans | 0.0 /100 | #314 | Tragic 81.7% |