Indonesian vs Menominee Cognitive Disability
COMPARE
Indonesian
Menominee
Cognitive Disability
Cognitive Disability Comparison
Indonesians
Menominee
18.7%
COGNITIVE DISABILITY
0.0/ 100
METRIC RATING
325th/ 347
METRIC RANK
18.0%
COGNITIVE DISABILITY
0.4/ 100
METRIC RATING
264th/ 347
METRIC RANK
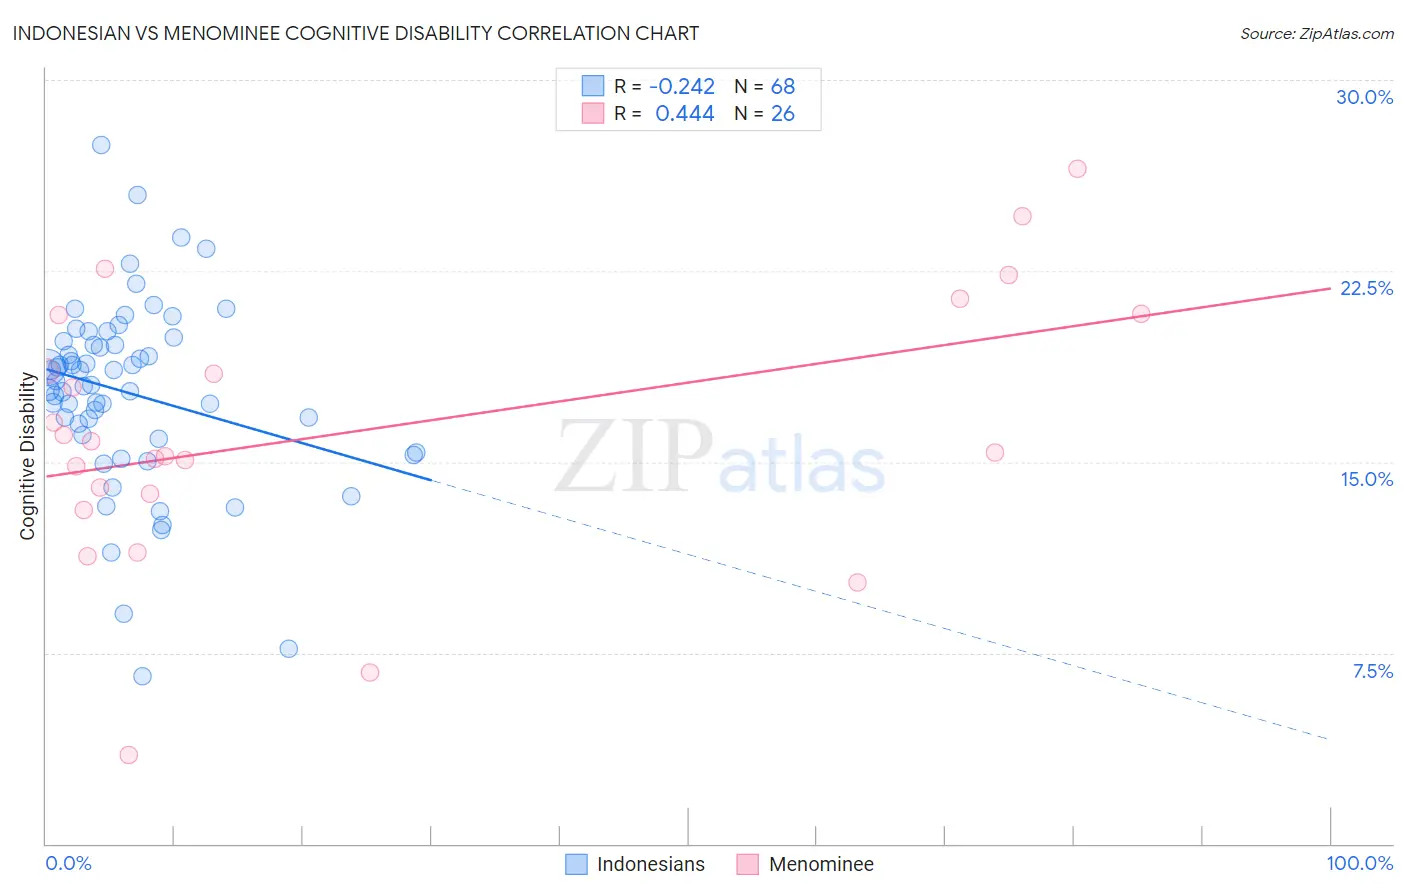
Indonesian vs Menominee Cognitive Disability Correlation Chart
The statistical analysis conducted on geographies consisting of 162,728,368 people shows a weak negative correlation between the proportion of Indonesians and percentage of population with cognitive disability in the United States with a correlation coefficient (R) of -0.242 and weighted average of 18.7%. Similarly, the statistical analysis conducted on geographies consisting of 45,777,849 people shows a moderate positive correlation between the proportion of Menominee and percentage of population with cognitive disability in the United States with a correlation coefficient (R) of 0.444 and weighted average of 18.0%, a difference of 4.1%.
Cognitive Disability Correlation Summary
| Measurement | Indonesian | Menominee |
| Minimum | 6.6% | 3.5% |
| Maximum | 27.5% | 26.5% |
| Range | 20.9% | 23.0% |
| Mean | 17.7% | 16.2% |
| Median | 18.1% | 15.6% |
| Interquartile 25% (IQ1) | 16.0% | 13.7% |
| Interquartile 75% (IQ3) | 19.7% | 20.8% |
| Interquartile Range (IQR) | 3.7% | 7.0% |
| Standard Deviation (Sample) | 3.7% | 5.3% |
| Standard Deviation (Population) | 3.7% | 5.2% |
Similar Demographics by Cognitive Disability
Demographics Similar to Indonesians by Cognitive Disability
In terms of cognitive disability, the demographic groups most similar to Indonesians are Immigrants from Senegal (18.7%, a difference of 0.020%), U.S. Virgin Islander (18.7%, a difference of 0.060%), Dominican (18.7%, a difference of 0.080%), Kiowa (18.7%, a difference of 0.12%), and Pueblo (18.7%, a difference of 0.20%).
| Demographics | Rating | Rank | Cognitive Disability |
| Bangladeshis | 0.0 /100 | #318 | Tragic 18.6% |
| Comanche | 0.0 /100 | #319 | Tragic 18.6% |
| Apache | 0.0 /100 | #320 | Tragic 18.6% |
| Africans | 0.0 /100 | #321 | Tragic 18.6% |
| Immigrants | Liberia | 0.0 /100 | #322 | Tragic 18.7% |
| Pueblo | 0.0 /100 | #323 | Tragic 18.7% |
| Dominicans | 0.0 /100 | #324 | Tragic 18.7% |
| Indonesians | 0.0 /100 | #325 | Tragic 18.7% |
| Immigrants | Senegal | 0.0 /100 | #326 | Tragic 18.7% |
| U.S. Virgin Islanders | 0.0 /100 | #327 | Tragic 18.7% |
| Kiowa | 0.0 /100 | #328 | Tragic 18.7% |
| Navajo | 0.0 /100 | #329 | Tragic 18.8% |
| Immigrants | Dominican Republic | 0.0 /100 | #330 | Tragic 18.8% |
| Pima | 0.0 /100 | #331 | Tragic 18.8% |
| Immigrants | Sudan | 0.0 /100 | #332 | Tragic 18.8% |
Demographics Similar to Menominee by Cognitive Disability
In terms of cognitive disability, the demographic groups most similar to Menominee are Spanish American (18.0%, a difference of 0.030%), Belizean (18.0%, a difference of 0.030%), Immigrants from Barbados (17.9%, a difference of 0.060%), Nepalese (18.0%, a difference of 0.090%), and Sierra Leonean (17.9%, a difference of 0.10%).
| Demographics | Rating | Rank | Cognitive Disability |
| Mexican American Indians | 0.6 /100 | #257 | Tragic 17.9% |
| Immigrants | Armenia | 0.6 /100 | #258 | Tragic 17.9% |
| Ethiopians | 0.5 /100 | #259 | Tragic 17.9% |
| Immigrants | Belize | 0.5 /100 | #260 | Tragic 17.9% |
| Guamanians/Chamorros | 0.5 /100 | #261 | Tragic 17.9% |
| Sierra Leoneans | 0.4 /100 | #262 | Tragic 17.9% |
| Immigrants | Barbados | 0.4 /100 | #263 | Tragic 17.9% |
| Menominee | 0.4 /100 | #264 | Tragic 18.0% |
| Spanish Americans | 0.4 /100 | #265 | Tragic 18.0% |
| Belizeans | 0.4 /100 | #266 | Tragic 18.0% |
| Nepalese | 0.3 /100 | #267 | Tragic 18.0% |
| Cherokee | 0.3 /100 | #268 | Tragic 18.0% |
| Hondurans | 0.3 /100 | #269 | Tragic 18.0% |
| Immigrants | Bahamas | 0.3 /100 | #270 | Tragic 18.0% |
| Potawatomi | 0.2 /100 | #271 | Tragic 18.0% |