Iranian vs Menominee Female Disability
COMPARE
Iranian
Menominee
Female Disability
Female Disability Comparison
Iranians
Menominee
10.6%
FEMALE DISABILITY
100.0/ 100
METRIC RATING
9th/ 347
METRIC RANK
12.6%
FEMALE DISABILITY
2.1/ 100
METRIC RATING
247th/ 347
METRIC RANK
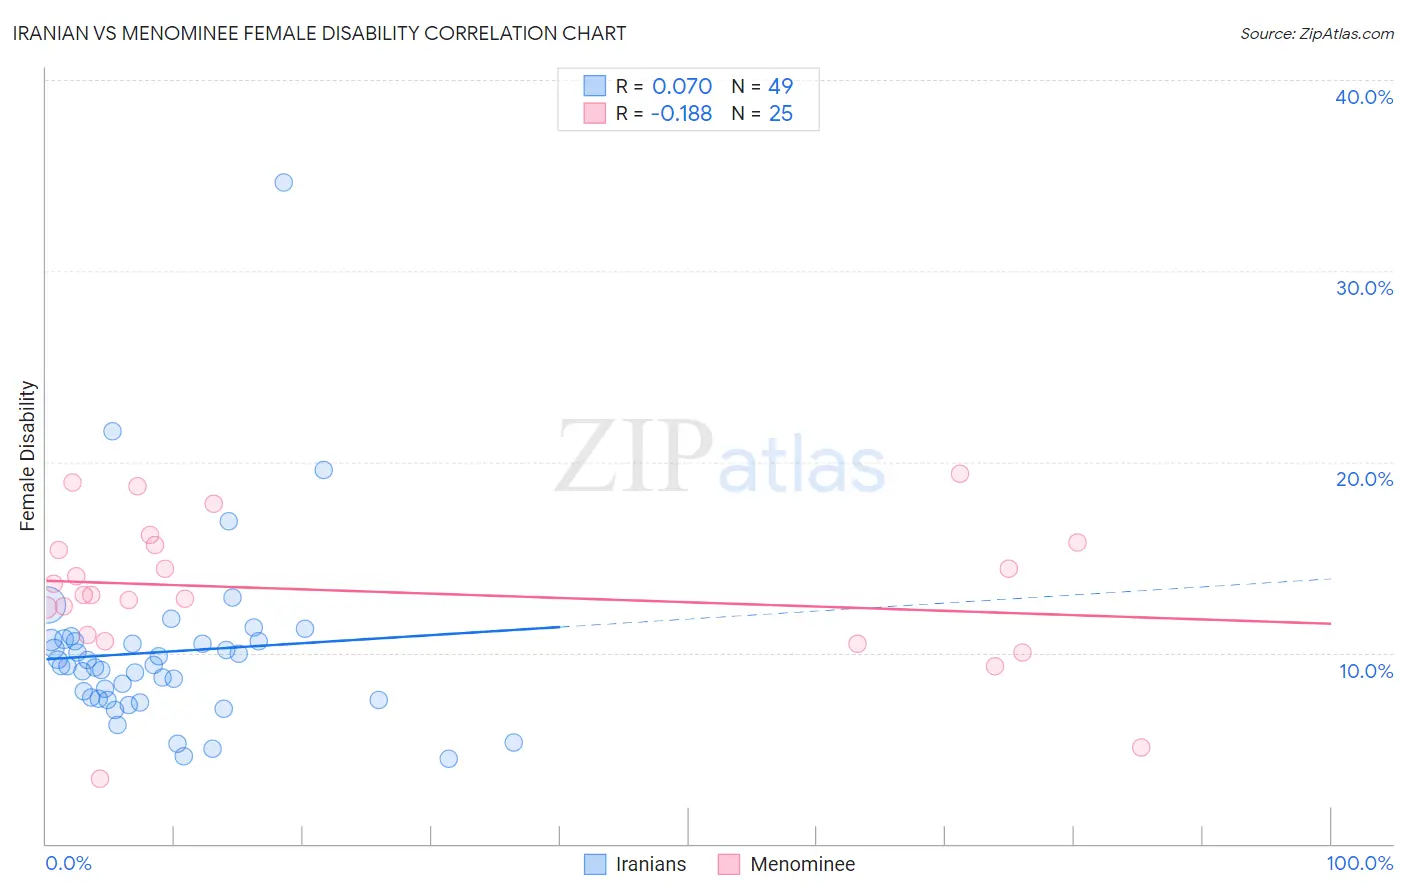
Iranian vs Menominee Female Disability Correlation Chart
The statistical analysis conducted on geographies consisting of 316,876,376 people shows a slight positive correlation between the proportion of Iranians and percentage of females with a disability in the United States with a correlation coefficient (R) of 0.070 and weighted average of 10.6%. Similarly, the statistical analysis conducted on geographies consisting of 45,777,730 people shows a poor negative correlation between the proportion of Menominee and percentage of females with a disability in the United States with a correlation coefficient (R) of -0.188 and weighted average of 12.6%, a difference of 19.8%.
Female Disability Correlation Summary
| Measurement | Iranian | Menominee |
| Minimum | 4.5% | 3.4% |
| Maximum | 34.6% | 19.4% |
| Range | 30.1% | 16.0% |
| Mean | 10.0% | 13.2% |
| Median | 9.3% | 13.0% |
| Interquartile 25% (IQ1) | 7.6% | 10.8% |
| Interquartile 75% (IQ3) | 10.6% | 15.7% |
| Interquartile Range (IQR) | 3.1% | 5.0% |
| Standard Deviation (Sample) | 4.8% | 3.9% |
| Standard Deviation (Population) | 4.8% | 3.8% |
Similar Demographics by Female Disability
Demographics Similar to Iranians by Female Disability
In terms of female disability, the demographic groups most similar to Iranians are Immigrants from Hong Kong (10.6%, a difference of 0.65%), Immigrants from Korea (10.6%, a difference of 0.82%), Immigrants from South Central Asia (10.5%, a difference of 0.91%), Immigrants from Singapore (10.4%, a difference of 1.1%), and Immigrants from Israel (10.7%, a difference of 1.2%).
| Demographics | Rating | Rank | Female Disability |
| Filipinos | 100.0 /100 | #2 | Exceptional 10.1% |
| Immigrants | Taiwan | 100.0 /100 | #3 | Exceptional 10.1% |
| Thais | 100.0 /100 | #4 | Exceptional 10.2% |
| Immigrants | Bolivia | 100.0 /100 | #5 | Exceptional 10.3% |
| Bolivians | 100.0 /100 | #6 | Exceptional 10.4% |
| Immigrants | Singapore | 100.0 /100 | #7 | Exceptional 10.4% |
| Immigrants | South Central Asia | 100.0 /100 | #8 | Exceptional 10.5% |
| Iranians | 100.0 /100 | #9 | Exceptional 10.6% |
| Immigrants | Hong Kong | 100.0 /100 | #10 | Exceptional 10.6% |
| Immigrants | Korea | 100.0 /100 | #11 | Exceptional 10.6% |
| Immigrants | Israel | 100.0 /100 | #12 | Exceptional 10.7% |
| Immigrants | Eastern Asia | 100.0 /100 | #13 | Exceptional 10.7% |
| Immigrants | China | 100.0 /100 | #14 | Exceptional 10.7% |
| Burmese | 100.0 /100 | #15 | Exceptional 10.7% |
| Okinawans | 100.0 /100 | #16 | Exceptional 10.8% |
Demographics Similar to Menominee by Female Disability
In terms of female disability, the demographic groups most similar to Menominee are Spanish American Indian (12.6%, a difference of 0.010%), Immigrants from Jamaica (12.6%, a difference of 0.030%), Carpatho Rusyn (12.6%, a difference of 0.040%), Alsatian (12.6%, a difference of 0.16%), and Immigrants from Congo (12.7%, a difference of 0.16%).
| Demographics | Rating | Rank | Female Disability |
| German Russians | 3.2 /100 | #240 | Tragic 12.6% |
| Japanese | 2.7 /100 | #241 | Tragic 12.6% |
| Canadians | 2.6 /100 | #242 | Tragic 12.6% |
| Immigrants | Senegal | 2.5 /100 | #243 | Tragic 12.6% |
| Alsatians | 2.5 /100 | #244 | Tragic 12.6% |
| Immigrants | Jamaica | 2.2 /100 | #245 | Tragic 12.6% |
| Spanish American Indians | 2.1 /100 | #246 | Tragic 12.6% |
| Menominee | 2.1 /100 | #247 | Tragic 12.6% |
| Carpatho Rusyns | 2.0 /100 | #248 | Tragic 12.6% |
| Immigrants | Congo | 1.8 /100 | #249 | Tragic 12.7% |
| Slovenes | 1.7 /100 | #250 | Tragic 12.7% |
| Crow | 1.6 /100 | #251 | Tragic 12.7% |
| Immigrants | Caribbean | 1.4 /100 | #252 | Tragic 12.7% |
| Jamaicans | 1.4 /100 | #253 | Tragic 12.7% |
| Hawaiians | 1.4 /100 | #254 | Tragic 12.7% |