Iranian vs Menominee Householder Income Over 65 years
COMPARE
Iranian
Menominee
Householder Income Over 65 years
Householder Income Over 65 years Comparison
Iranians
Menominee
$77,429
HOUSEHOLDER INCOME OVER 65 YEARS
100.0/ 100
METRIC RATING
2nd/ 347
METRIC RANK
$51,719
HOUSEHOLDER INCOME OVER 65 YEARS
0.0/ 100
METRIC RATING
321st/ 347
METRIC RANK
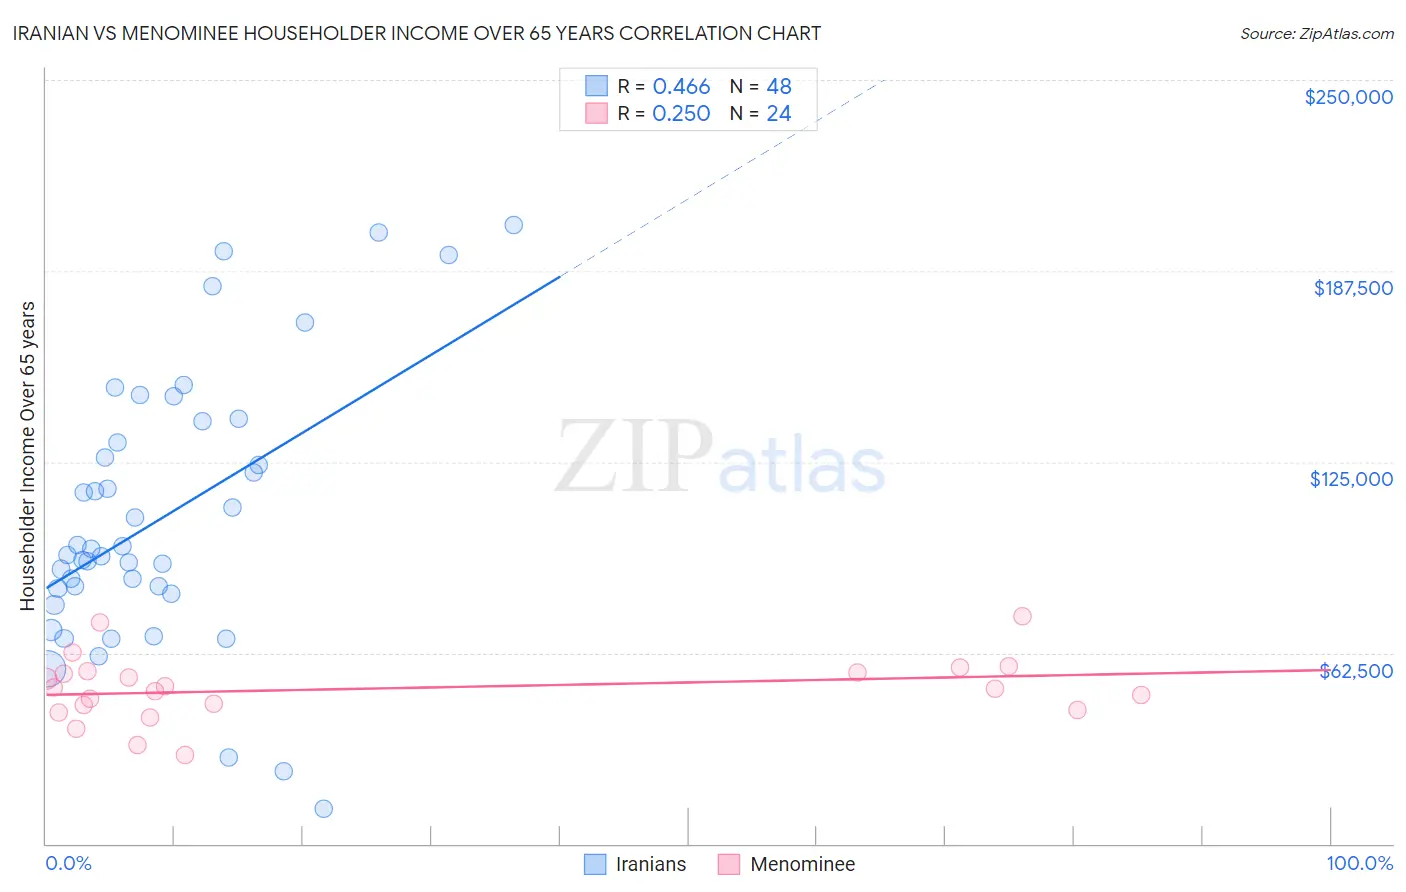
Iranian vs Menominee Householder Income Over 65 years Correlation Chart
The statistical analysis conducted on geographies consisting of 316,043,836 people shows a moderate positive correlation between the proportion of Iranians and household income with householder over the age of 65 in the United States with a correlation coefficient (R) of 0.466 and weighted average of $77,429. Similarly, the statistical analysis conducted on geographies consisting of 45,767,067 people shows a weak positive correlation between the proportion of Menominee and household income with householder over the age of 65 in the United States with a correlation coefficient (R) of 0.250 and weighted average of $51,719, a difference of 49.7%.
Householder Income Over 65 years Correlation Summary
| Measurement | Iranian | Menominee |
| Minimum | $11,563 | $29,125 |
| Maximum | $202,500 | $74,432 |
| Range | $190,937 | $45,307 |
| Mean | $106,815 | $50,793 |
| Median | $95,602 | $50,939 |
| Interquartile 25% (IQ1) | $82,658 | $44,602 |
| Interquartile 75% (IQ3) | $134,972 | $56,259 |
| Interquartile Range (IQR) | $52,314 | $11,657 |
| Standard Deviation (Sample) | $44,529 | $10,695 |
| Standard Deviation (Population) | $44,062 | $10,470 |
Similar Demographics by Householder Income Over 65 years
Demographics Similar to Iranians by Householder Income Over 65 years
In terms of householder income over 65 years, the demographic groups most similar to Iranians are Chinese ($77,465, a difference of 0.050%), Immigrants from Taiwan ($77,051, a difference of 0.49%), Filipino ($76,686, a difference of 0.97%), Immigrants from Iran ($75,081, a difference of 3.1%), and Bolivian ($74,245, a difference of 4.3%).
| Demographics | Rating | Rank | Householder Income Over 65 years |
| Chinese | 100.0 /100 | #1 | Exceptional $77,465 |
| Iranians | 100.0 /100 | #2 | Exceptional $77,429 |
| Immigrants | Taiwan | 100.0 /100 | #3 | Exceptional $77,051 |
| Filipinos | 100.0 /100 | #4 | Exceptional $76,686 |
| Immigrants | Iran | 100.0 /100 | #5 | Exceptional $75,081 |
| Bolivians | 100.0 /100 | #6 | Exceptional $74,245 |
| Immigrants | Bolivia | 100.0 /100 | #7 | Exceptional $73,434 |
| Immigrants | Singapore | 100.0 /100 | #8 | Exceptional $72,963 |
| Immigrants | India | 100.0 /100 | #9 | Exceptional $72,804 |
| Bhutanese | 100.0 /100 | #10 | Exceptional $72,288 |
| Thais | 100.0 /100 | #11 | Exceptional $72,099 |
| Cypriots | 100.0 /100 | #12 | Exceptional $71,714 |
| Immigrants | Hong Kong | 100.0 /100 | #13 | Exceptional $71,567 |
| Burmese | 100.0 /100 | #14 | Exceptional $71,139 |
| Native Hawaiians | 100.0 /100 | #15 | Exceptional $71,021 |
Demographics Similar to Menominee by Householder Income Over 65 years
In terms of householder income over 65 years, the demographic groups most similar to Menominee are Colville ($51,739, a difference of 0.040%), Immigrants from Honduras ($51,888, a difference of 0.33%), Haitian ($51,912, a difference of 0.37%), Immigrants from St. Vincent and the Grenadines ($51,922, a difference of 0.39%), and Creek ($51,949, a difference of 0.45%).
| Demographics | Rating | Rank | Householder Income Over 65 years |
| Natives/Alaskans | 0.0 /100 | #314 | Tragic $52,081 |
| U.S. Virgin Islanders | 0.0 /100 | #315 | Tragic $52,072 |
| Creek | 0.0 /100 | #316 | Tragic $51,949 |
| Immigrants | St. Vincent and the Grenadines | 0.0 /100 | #317 | Tragic $51,922 |
| Haitians | 0.0 /100 | #318 | Tragic $51,912 |
| Immigrants | Honduras | 0.0 /100 | #319 | Tragic $51,888 |
| Colville | 0.0 /100 | #320 | Tragic $51,739 |
| Menominee | 0.0 /100 | #321 | Tragic $51,719 |
| British West Indians | 0.0 /100 | #322 | Tragic $51,463 |
| Cajuns | 0.0 /100 | #323 | Tragic $51,397 |
| Immigrants | Congo | 0.0 /100 | #324 | Tragic $51,393 |
| Immigrants | Haiti | 0.0 /100 | #325 | Tragic $51,219 |
| Kiowa | 0.0 /100 | #326 | Tragic $51,140 |
| Bahamians | 0.0 /100 | #327 | Tragic $51,000 |
| Hopi | 0.0 /100 | #328 | Tragic $50,925 |