Polish vs Immigrants from Ukraine Cognitive Disability
COMPARE
Polish
Immigrants from Ukraine
Cognitive Disability
Cognitive Disability Comparison
Poles
Immigrants from Ukraine
16.4%
COGNITIVE DISABILITY
99.9/ 100
METRIC RATING
28th/ 347
METRIC RANK
16.6%
COGNITIVE DISABILITY
99.5/ 100
METRIC RATING
66th/ 347
METRIC RANK
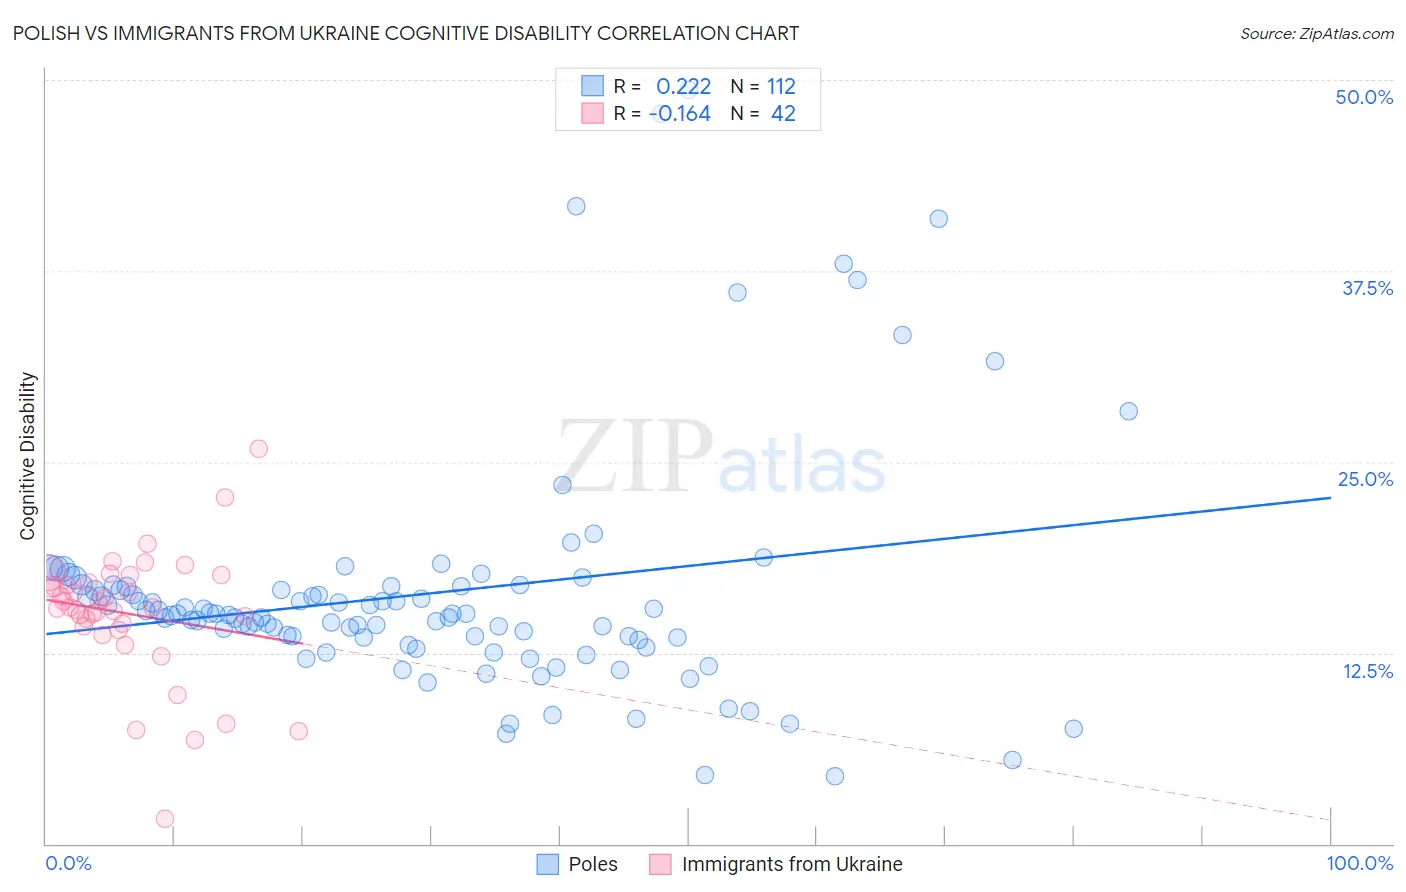
Polish vs Immigrants from Ukraine Cognitive Disability Correlation Chart
The statistical analysis conducted on geographies consisting of 560,438,383 people shows a weak positive correlation between the proportion of Poles and percentage of population with cognitive disability in the United States with a correlation coefficient (R) of 0.222 and weighted average of 16.4%. Similarly, the statistical analysis conducted on geographies consisting of 289,689,881 people shows a poor negative correlation between the proportion of Immigrants from Ukraine and percentage of population with cognitive disability in the United States with a correlation coefficient (R) of -0.164 and weighted average of 16.6%, a difference of 1.5%.
Cognitive Disability Correlation Summary
| Measurement | Polish | Immigrants from Ukraine |
| Minimum | 4.4% | 1.6% |
| Maximum | 49.3% | 25.9% |
| Range | 44.9% | 24.3% |
| Mean | 16.4% | 15.1% |
| Median | 15.0% | 15.5% |
| Interquartile 25% (IQ1) | 13.4% | 14.3% |
| Interquartile 75% (IQ3) | 16.8% | 17.1% |
| Interquartile Range (IQR) | 3.4% | 2.9% |
| Standard Deviation (Sample) | 7.8% | 4.2% |
| Standard Deviation (Population) | 7.8% | 4.2% |
Similar Demographics by Cognitive Disability
Demographics Similar to Poles by Cognitive Disability
In terms of cognitive disability, the demographic groups most similar to Poles are Immigrants from Pakistan (16.4%, a difference of 0.0%), Immigrants from Croatia (16.4%, a difference of 0.020%), Filipino (16.4%, a difference of 0.030%), Czech (16.4%, a difference of 0.030%), and Luxembourger (16.4%, a difference of 0.050%).
| Demographics | Rating | Rank | Cognitive Disability |
| Immigrants | Cuba | 100.0 /100 | #21 | Exceptional 16.3% |
| Immigrants | South Central Asia | 99.9 /100 | #22 | Exceptional 16.4% |
| Croatians | 99.9 /100 | #23 | Exceptional 16.4% |
| Immigrants | Argentina | 99.9 /100 | #24 | Exceptional 16.4% |
| Luxembourgers | 99.9 /100 | #25 | Exceptional 16.4% |
| Immigrants | Croatia | 99.9 /100 | #26 | Exceptional 16.4% |
| Immigrants | Pakistan | 99.9 /100 | #27 | Exceptional 16.4% |
| Poles | 99.9 /100 | #28 | Exceptional 16.4% |
| Filipinos | 99.9 /100 | #29 | Exceptional 16.4% |
| Czechs | 99.9 /100 | #30 | Exceptional 16.4% |
| Immigrants | Romania | 99.9 /100 | #31 | Exceptional 16.4% |
| Immigrants | Israel | 99.9 /100 | #32 | Exceptional 16.4% |
| Italians | 99.9 /100 | #33 | Exceptional 16.4% |
| Russians | 99.9 /100 | #34 | Exceptional 16.4% |
| Slovaks | 99.9 /100 | #35 | Exceptional 16.4% |
Demographics Similar to Immigrants from Ukraine by Cognitive Disability
In terms of cognitive disability, the demographic groups most similar to Immigrants from Ukraine are Latvian (16.6%, a difference of 0.040%), Ukrainian (16.6%, a difference of 0.080%), Colombian (16.6%, a difference of 0.12%), Venezuelan (16.6%, a difference of 0.14%), and Immigrants from Uzbekistan (16.7%, a difference of 0.16%).
| Demographics | Rating | Rank | Cognitive Disability |
| Immigrants | Peru | 99.7 /100 | #59 | Exceptional 16.6% |
| Romanians | 99.7 /100 | #60 | Exceptional 16.6% |
| Immigrants | England | 99.6 /100 | #61 | Exceptional 16.6% |
| Czechoslovakians | 99.6 /100 | #62 | Exceptional 16.6% |
| Argentineans | 99.6 /100 | #63 | Exceptional 16.6% |
| Venezuelans | 99.6 /100 | #64 | Exceptional 16.6% |
| Colombians | 99.6 /100 | #65 | Exceptional 16.6% |
| Immigrants | Ukraine | 99.5 /100 | #66 | Exceptional 16.6% |
| Latvians | 99.5 /100 | #67 | Exceptional 16.6% |
| Ukrainians | 99.4 /100 | #68 | Exceptional 16.6% |
| Immigrants | Uzbekistan | 99.4 /100 | #69 | Exceptional 16.7% |
| Immigrants | Sweden | 99.4 /100 | #70 | Exceptional 16.7% |
| Immigrants | Belgium | 99.3 /100 | #71 | Exceptional 16.7% |
| Germans | 99.3 /100 | #72 | Exceptional 16.7% |
| Burmese | 99.3 /100 | #73 | Exceptional 16.7% |