Asian vs Immigrants from Ukraine Cognitive Disability
COMPARE
Asian
Immigrants from Ukraine
Cognitive Disability
Cognitive Disability Comparison
Asians
Immigrants from Ukraine
16.7%
COGNITIVE DISABILITY
98.7/ 100
METRIC RATING
94th/ 347
METRIC RANK
16.6%
COGNITIVE DISABILITY
99.5/ 100
METRIC RATING
66th/ 347
METRIC RANK
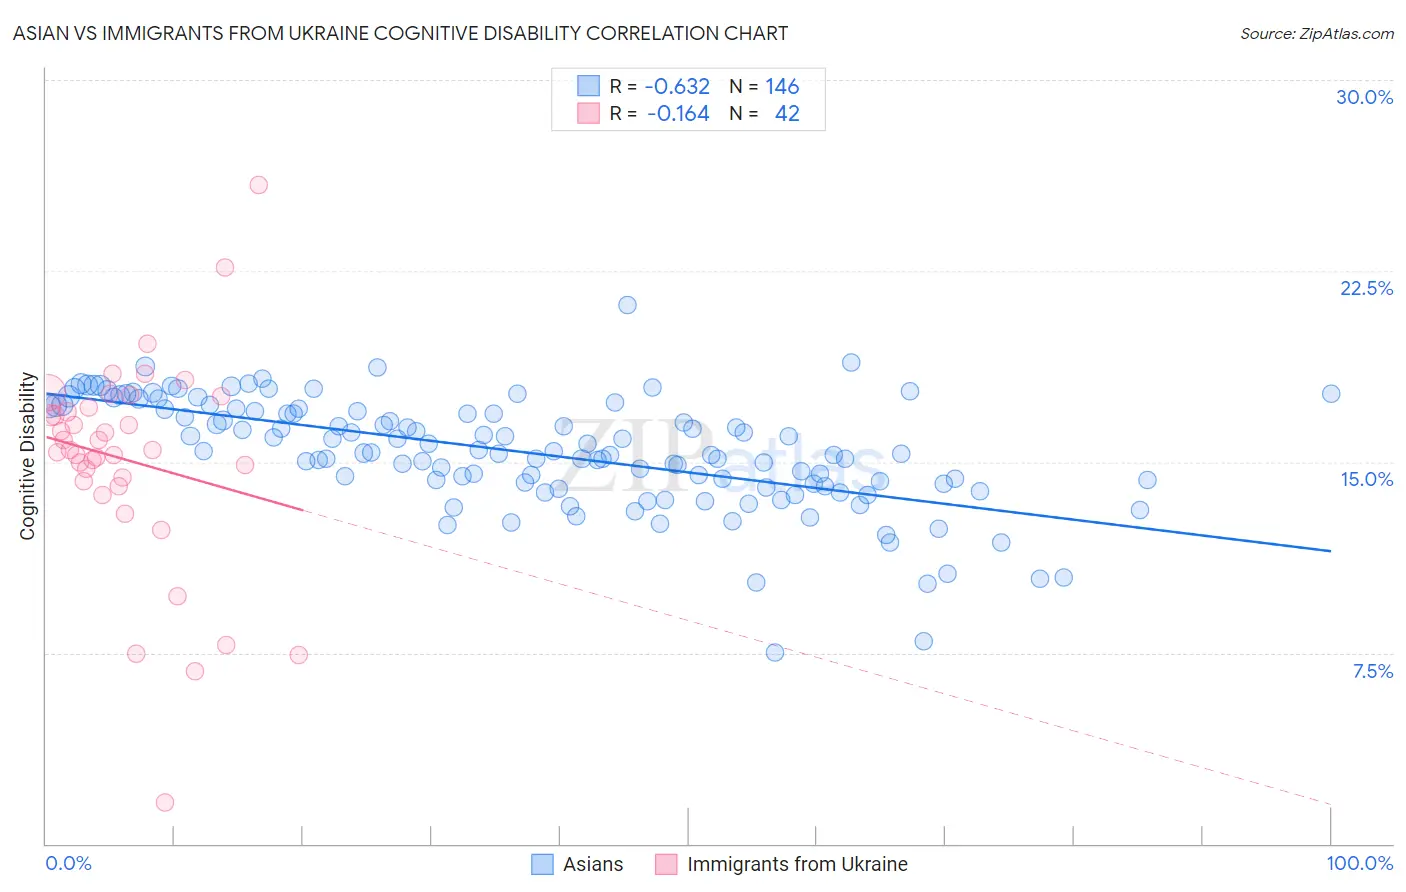
Asian vs Immigrants from Ukraine Cognitive Disability Correlation Chart
The statistical analysis conducted on geographies consisting of 550,791,869 people shows a significant negative correlation between the proportion of Asians and percentage of population with cognitive disability in the United States with a correlation coefficient (R) of -0.632 and weighted average of 16.7%. Similarly, the statistical analysis conducted on geographies consisting of 289,689,881 people shows a poor negative correlation between the proportion of Immigrants from Ukraine and percentage of population with cognitive disability in the United States with a correlation coefficient (R) of -0.164 and weighted average of 16.6%, a difference of 0.70%.
Cognitive Disability Correlation Summary
| Measurement | Asian | Immigrants from Ukraine |
| Minimum | 7.5% | 1.6% |
| Maximum | 21.2% | 25.9% |
| Range | 13.7% | 24.3% |
| Mean | 15.4% | 15.1% |
| Median | 15.4% | 15.5% |
| Interquartile 25% (IQ1) | 14.2% | 14.3% |
| Interquartile 75% (IQ3) | 17.1% | 17.1% |
| Interquartile Range (IQR) | 3.0% | 2.9% |
| Standard Deviation (Sample) | 2.2% | 4.2% |
| Standard Deviation (Population) | 2.2% | 4.2% |
Similar Demographics by Cognitive Disability
Demographics Similar to Asians by Cognitive Disability
In terms of cognitive disability, the demographic groups most similar to Asians are Immigrants from Southern Europe (16.7%, a difference of 0.040%), Immigrants from South America (16.7%, a difference of 0.050%), Danish (16.7%, a difference of 0.060%), English (16.8%, a difference of 0.060%), and Immigrants from Egypt (16.7%, a difference of 0.070%).
| Demographics | Rating | Rank | Cognitive Disability |
| Native Hawaiians | 99.0 /100 | #87 | Exceptional 16.7% |
| Immigrants | Philippines | 99.0 /100 | #88 | Exceptional 16.7% |
| Immigrants | Egypt | 98.8 /100 | #89 | Exceptional 16.7% |
| South Americans | 98.8 /100 | #90 | Exceptional 16.7% |
| Danes | 98.8 /100 | #91 | Exceptional 16.7% |
| Immigrants | South America | 98.8 /100 | #92 | Exceptional 16.7% |
| Immigrants | Southern Europe | 98.7 /100 | #93 | Exceptional 16.7% |
| Asians | 98.7 /100 | #94 | Exceptional 16.7% |
| English | 98.6 /100 | #95 | Exceptional 16.8% |
| Finns | 98.5 /100 | #96 | Exceptional 16.8% |
| Dutch | 98.5 /100 | #97 | Exceptional 16.8% |
| Immigrants | Lebanon | 98.4 /100 | #98 | Exceptional 16.8% |
| Jordanians | 98.2 /100 | #99 | Exceptional 16.8% |
| Immigrants | Russia | 98.2 /100 | #100 | Exceptional 16.8% |
| Immigrants | Asia | 98.1 /100 | #101 | Exceptional 16.8% |
Demographics Similar to Immigrants from Ukraine by Cognitive Disability
In terms of cognitive disability, the demographic groups most similar to Immigrants from Ukraine are Latvian (16.6%, a difference of 0.040%), Ukrainian (16.6%, a difference of 0.080%), Colombian (16.6%, a difference of 0.12%), Venezuelan (16.6%, a difference of 0.14%), and Immigrants from Uzbekistan (16.7%, a difference of 0.16%).
| Demographics | Rating | Rank | Cognitive Disability |
| Immigrants | Peru | 99.7 /100 | #59 | Exceptional 16.6% |
| Romanians | 99.7 /100 | #60 | Exceptional 16.6% |
| Immigrants | England | 99.6 /100 | #61 | Exceptional 16.6% |
| Czechoslovakians | 99.6 /100 | #62 | Exceptional 16.6% |
| Argentineans | 99.6 /100 | #63 | Exceptional 16.6% |
| Venezuelans | 99.6 /100 | #64 | Exceptional 16.6% |
| Colombians | 99.6 /100 | #65 | Exceptional 16.6% |
| Immigrants | Ukraine | 99.5 /100 | #66 | Exceptional 16.6% |
| Latvians | 99.5 /100 | #67 | Exceptional 16.6% |
| Ukrainians | 99.4 /100 | #68 | Exceptional 16.6% |
| Immigrants | Uzbekistan | 99.4 /100 | #69 | Exceptional 16.7% |
| Immigrants | Sweden | 99.4 /100 | #70 | Exceptional 16.7% |
| Immigrants | Belgium | 99.3 /100 | #71 | Exceptional 16.7% |
| Germans | 99.3 /100 | #72 | Exceptional 16.7% |
| Burmese | 99.3 /100 | #73 | Exceptional 16.7% |