Iranian vs Immigrants from Ukraine Female Unemployment
COMPARE
Iranian
Immigrants from Ukraine
Female Unemployment
Female Unemployment Comparison
Iranians
Immigrants from Ukraine
5.3%
FEMALE UNEMPLOYMENT
50.4/ 100
METRIC RATING
173rd/ 347
METRIC RANK
5.3%
FEMALE UNEMPLOYMENT
40.1/ 100
METRIC RATING
184th/ 347
METRIC RANK
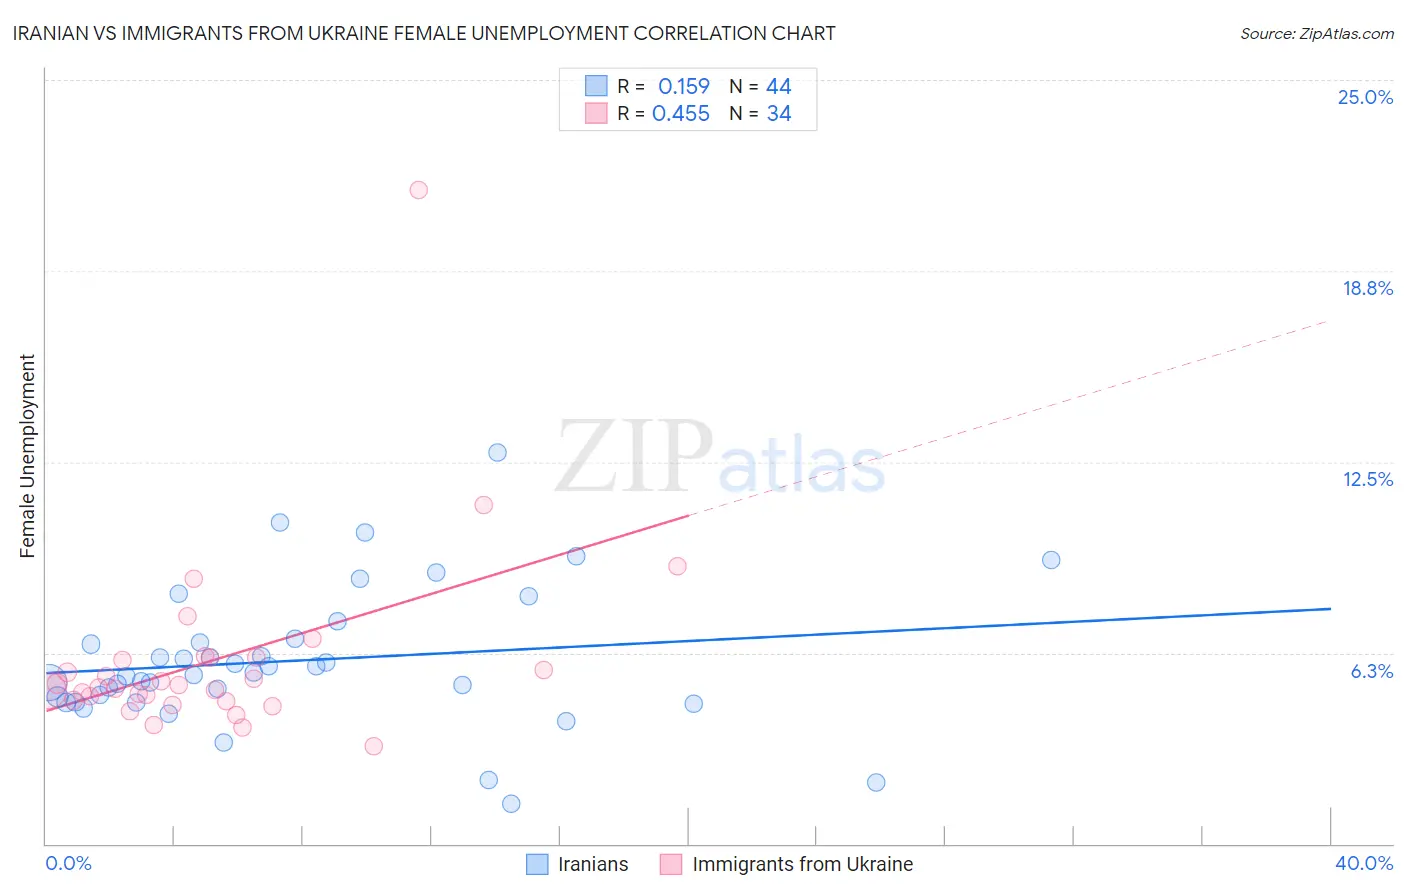
Iranian vs Immigrants from Ukraine Female Unemployment Correlation Chart
The statistical analysis conducted on geographies consisting of 316,106,096 people shows a poor positive correlation between the proportion of Iranians and unemploymnet rate among females in the United States with a correlation coefficient (R) of 0.159 and weighted average of 5.3%. Similarly, the statistical analysis conducted on geographies consisting of 288,858,006 people shows a moderate positive correlation between the proportion of Immigrants from Ukraine and unemploymnet rate among females in the United States with a correlation coefficient (R) of 0.455 and weighted average of 5.3%, a difference of 0.62%.
Female Unemployment Correlation Summary
| Measurement | Iranian | Immigrants from Ukraine |
| Minimum | 1.3% | 3.2% |
| Maximum | 12.8% | 21.4% |
| Range | 11.5% | 18.2% |
| Mean | 6.0% | 6.0% |
| Median | 5.6% | 5.2% |
| Interquartile 25% (IQ1) | 4.7% | 4.7% |
| Interquartile 75% (IQ3) | 6.6% | 6.1% |
| Interquartile Range (IQR) | 1.9% | 1.4% |
| Standard Deviation (Sample) | 2.3% | 3.1% |
| Standard Deviation (Population) | 2.2% | 3.1% |
Demographics Similar to Iranians and Immigrants from Ukraine by Female Unemployment
In terms of female unemployment, the demographic groups most similar to Iranians are Immigrants from Uganda (5.3%, a difference of 0.020%), Immigrants from Poland (5.3%, a difference of 0.020%), Immigrants from Laos (5.3%, a difference of 0.17%), Immigrants from Vietnam (5.3%, a difference of 0.18%), and Immigrants from Morocco (5.3%, a difference of 0.18%). Similarly, the demographic groups most similar to Immigrants from Ukraine are Malaysian (5.3%, a difference of 0.010%), Immigrants from Indonesia (5.3%, a difference of 0.030%), Immigrants from Belarus (5.3%, a difference of 0.050%), Nonimmigrants (5.3%, a difference of 0.15%), and Taiwanese (5.3%, a difference of 0.16%).
| Demographics | Rating | Rank | Female Unemployment |
| Sri Lankans | 59.4 /100 | #168 | Average 5.2% |
| Immigrants | Chile | 59.0 /100 | #169 | Average 5.2% |
| Spanish | 55.9 /100 | #170 | Average 5.2% |
| Immigrants | Denmark | 55.0 /100 | #171 | Average 5.2% |
| Immigrants | Uganda | 50.7 /100 | #172 | Average 5.3% |
| Iranians | 50.4 /100 | #173 | Average 5.3% |
| Immigrants | Poland | 50.0 /100 | #174 | Average 5.3% |
| Immigrants | Laos | 47.5 /100 | #175 | Average 5.3% |
| Immigrants | Vietnam | 47.5 /100 | #176 | Average 5.3% |
| Immigrants | Morocco | 47.4 /100 | #177 | Average 5.3% |
| Immigrants | Southern Europe | 46.2 /100 | #178 | Average 5.3% |
| Laotians | 45.1 /100 | #179 | Average 5.3% |
| Immigrants | Congo | 43.1 /100 | #180 | Average 5.3% |
| Taiwanese | 42.7 /100 | #181 | Average 5.3% |
| Immigrants | Nonimmigrants | 42.6 /100 | #182 | Average 5.3% |
| Immigrants | Indonesia | 40.7 /100 | #183 | Average 5.3% |
| Immigrants | Ukraine | 40.1 /100 | #184 | Average 5.3% |
| Malaysians | 40.1 /100 | #185 | Average 5.3% |
| Immigrants | Belarus | 39.4 /100 | #186 | Fair 5.3% |
| Immigrants | Albania | 35.4 /100 | #187 | Fair 5.3% |
| Afghans | 33.9 /100 | #188 | Fair 5.3% |