Immigrants from Brazil vs Immigrants from Ukraine Cognitive Disability
COMPARE
Immigrants from Brazil
Immigrants from Ukraine
Cognitive Disability
Cognitive Disability Comparison
Immigrants from Brazil
Immigrants from Ukraine
17.0%
COGNITIVE DISABILITY
89.3/ 100
METRIC RATING
144th/ 347
METRIC RANK
16.6%
COGNITIVE DISABILITY
99.5/ 100
METRIC RATING
66th/ 347
METRIC RANK
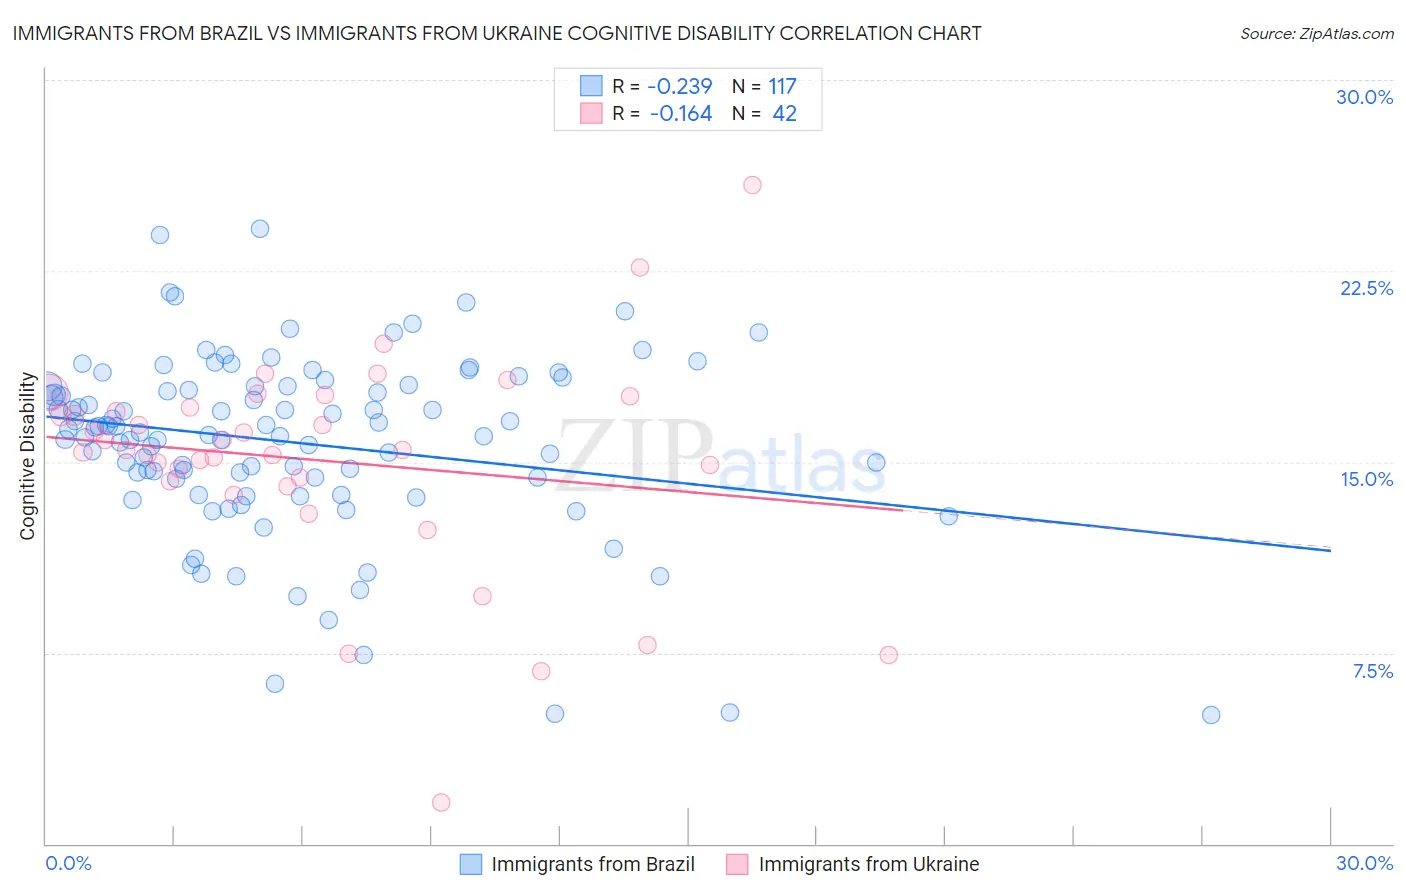
Immigrants from Brazil vs Immigrants from Ukraine Cognitive Disability Correlation Chart
The statistical analysis conducted on geographies consisting of 343,010,044 people shows a weak negative correlation between the proportion of Immigrants from Brazil and percentage of population with cognitive disability in the United States with a correlation coefficient (R) of -0.239 and weighted average of 17.0%. Similarly, the statistical analysis conducted on geographies consisting of 289,689,881 people shows a poor negative correlation between the proportion of Immigrants from Ukraine and percentage of population with cognitive disability in the United States with a correlation coefficient (R) of -0.164 and weighted average of 16.6%, a difference of 2.3%.
Cognitive Disability Correlation Summary
| Measurement | Immigrants from Brazil | Immigrants from Ukraine |
| Minimum | 5.1% | 1.6% |
| Maximum | 24.2% | 25.9% |
| Range | 19.1% | 24.3% |
| Mean | 15.8% | 15.1% |
| Median | 16.3% | 15.5% |
| Interquartile 25% (IQ1) | 14.4% | 14.3% |
| Interquartile 75% (IQ3) | 18.0% | 17.1% |
| Interquartile Range (IQR) | 3.6% | 2.9% |
| Standard Deviation (Sample) | 3.5% | 4.2% |
| Standard Deviation (Population) | 3.5% | 4.2% |
Similar Demographics by Cognitive Disability
Demographics Similar to Immigrants from Brazil by Cognitive Disability
In terms of cognitive disability, the demographic groups most similar to Immigrants from Brazil are British (17.0%, a difference of 0.0%), Carpatho Rusyn (17.0%, a difference of 0.020%), French (17.0%, a difference of 0.050%), Chilean (17.0%, a difference of 0.050%), and Aleut (17.0%, a difference of 0.050%).
| Demographics | Rating | Rank | Cognitive Disability |
| Immigrants | Norway | 90.9 /100 | #137 | Exceptional 17.0% |
| Welsh | 90.8 /100 | #138 | Exceptional 17.0% |
| French | 90.0 /100 | #139 | Excellent 17.0% |
| Chileans | 89.9 /100 | #140 | Excellent 17.0% |
| Aleuts | 89.9 /100 | #141 | Excellent 17.0% |
| Carpatho Rusyns | 89.6 /100 | #142 | Excellent 17.0% |
| British | 89.3 /100 | #143 | Excellent 17.0% |
| Immigrants | Brazil | 89.3 /100 | #144 | Excellent 17.0% |
| Immigrants | South Eastern Asia | 88.7 /100 | #145 | Excellent 17.0% |
| Costa Ricans | 88.0 /100 | #146 | Excellent 17.0% |
| Scotch-Irish | 85.9 /100 | #147 | Excellent 17.1% |
| French Canadians | 85.7 /100 | #148 | Excellent 17.1% |
| Cypriots | 85.7 /100 | #149 | Excellent 17.1% |
| Basques | 85.5 /100 | #150 | Excellent 17.1% |
| Syrians | 83.0 /100 | #151 | Excellent 17.1% |
Demographics Similar to Immigrants from Ukraine by Cognitive Disability
In terms of cognitive disability, the demographic groups most similar to Immigrants from Ukraine are Latvian (16.6%, a difference of 0.040%), Ukrainian (16.6%, a difference of 0.080%), Colombian (16.6%, a difference of 0.12%), Venezuelan (16.6%, a difference of 0.14%), and Immigrants from Uzbekistan (16.7%, a difference of 0.16%).
| Demographics | Rating | Rank | Cognitive Disability |
| Immigrants | Peru | 99.7 /100 | #59 | Exceptional 16.6% |
| Romanians | 99.7 /100 | #60 | Exceptional 16.6% |
| Immigrants | England | 99.6 /100 | #61 | Exceptional 16.6% |
| Czechoslovakians | 99.6 /100 | #62 | Exceptional 16.6% |
| Argentineans | 99.6 /100 | #63 | Exceptional 16.6% |
| Venezuelans | 99.6 /100 | #64 | Exceptional 16.6% |
| Colombians | 99.6 /100 | #65 | Exceptional 16.6% |
| Immigrants | Ukraine | 99.5 /100 | #66 | Exceptional 16.6% |
| Latvians | 99.5 /100 | #67 | Exceptional 16.6% |
| Ukrainians | 99.4 /100 | #68 | Exceptional 16.6% |
| Immigrants | Uzbekistan | 99.4 /100 | #69 | Exceptional 16.7% |
| Immigrants | Sweden | 99.4 /100 | #70 | Exceptional 16.7% |
| Immigrants | Belgium | 99.3 /100 | #71 | Exceptional 16.7% |
| Germans | 99.3 /100 | #72 | Exceptional 16.7% |
| Burmese | 99.3 /100 | #73 | Exceptional 16.7% |