Alaska Native vs Immigrants from Uganda Disability Age Under 5
COMPARE
Alaska Native
Immigrants from Uganda
Disability Age Under 5
Disability Age Under 5 Comparison
Alaska Natives
Immigrants from Uganda
2.9%
DISABILITY AGE UNDER 5
0.0/ 100
METRIC RATING
342nd/ 347
METRIC RANK
1.1%
DISABILITY AGE UNDER 5
96.1/ 100
METRIC RATING
101st/ 347
METRIC RANK
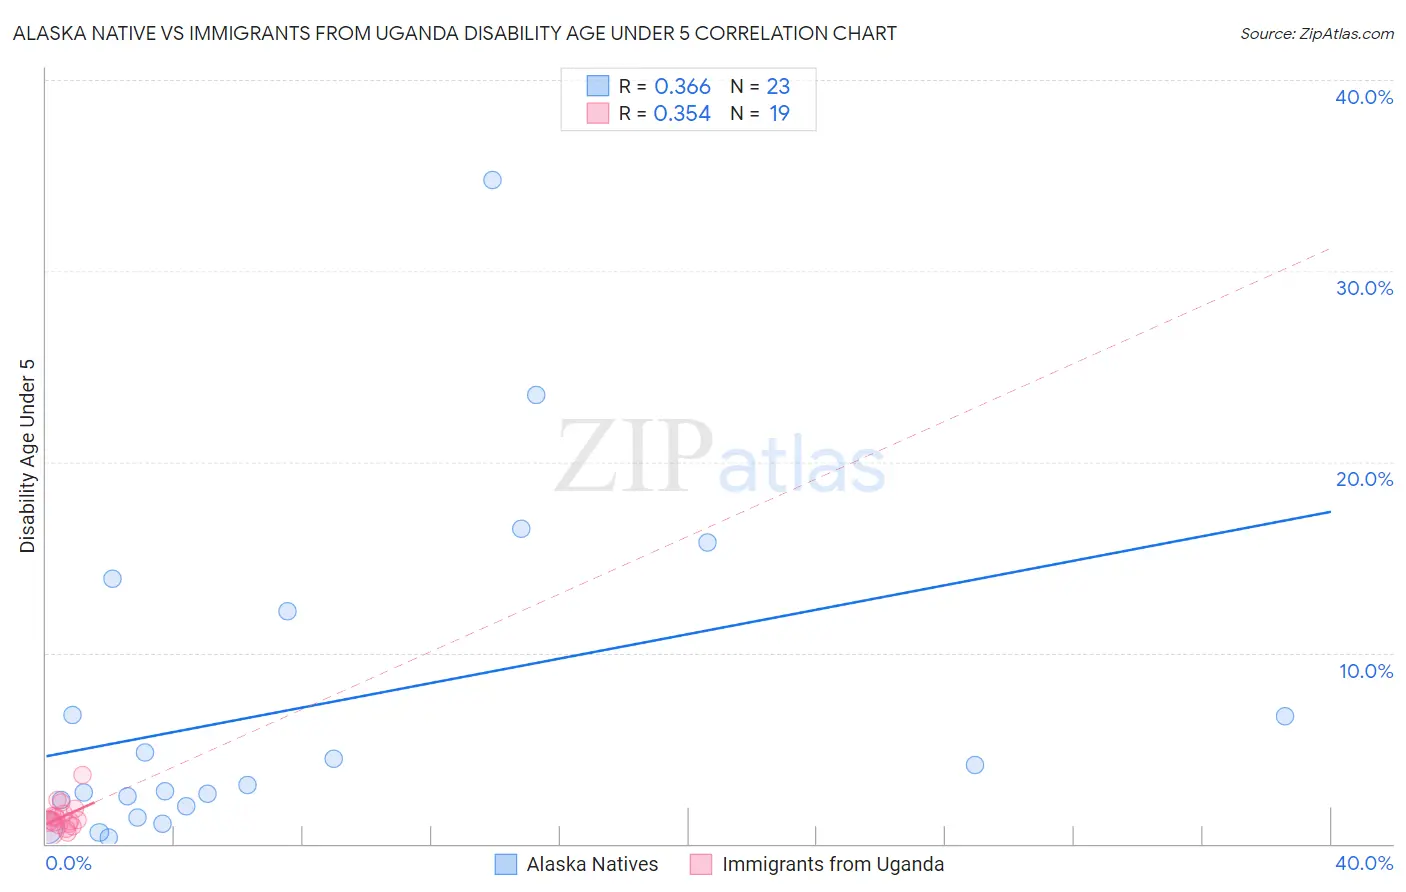
Alaska Native vs Immigrants from Uganda Disability Age Under 5 Correlation Chart
The statistical analysis conducted on geographies consisting of 62,848,423 people shows a mild positive correlation between the proportion of Alaska Natives and percentage of population with a disability under the age of 5 in the United States with a correlation coefficient (R) of 0.366 and weighted average of 2.9%. Similarly, the statistical analysis conducted on geographies consisting of 93,852,660 people shows a mild positive correlation between the proportion of Immigrants from Uganda and percentage of population with a disability under the age of 5 in the United States with a correlation coefficient (R) of 0.354 and weighted average of 1.1%, a difference of 155.8%.
Disability Age Under 5 Correlation Summary
| Measurement | Alaska Native | Immigrants from Uganda |
| Minimum | 0.35% | 0.59% |
| Maximum | 34.8% | 3.6% |
| Range | 34.4% | 3.0% |
| Mean | 7.2% | 1.4% |
| Median | 3.1% | 1.2% |
| Interquartile 25% (IQ1) | 2.0% | 0.98% |
| Interquartile 75% (IQ3) | 12.2% | 1.6% |
| Interquartile Range (IQR) | 10.2% | 0.59% |
| Standard Deviation (Sample) | 8.6% | 0.69% |
| Standard Deviation (Population) | 8.4% | 0.67% |
Similar Demographics by Disability Age Under 5
Demographics Similar to Alaska Natives by Disability Age Under 5
In terms of disability age under 5, the demographic groups most similar to Alaska Natives are Colville (3.3%, a difference of 11.6%), Tsimshian (2.4%, a difference of 22.1%), Inupiat (3.7%, a difference of 26.1%), Menominee (2.3%, a difference of 28.1%), and Immigrants from the Azores (2.2%, a difference of 31.6%).
| Demographics | Rating | Rank | Disability Age Under 5 |
| Dutch West Indians | 0.0 /100 | #333 | Tragic 1.9% |
| Natives/Alaskans | 0.0 /100 | #334 | Tragic 1.9% |
| Pennsylvania Germans | 0.0 /100 | #335 | Tragic 1.9% |
| Paraguayans | 0.0 /100 | #336 | Tragic 2.0% |
| Apache | 0.0 /100 | #337 | Tragic 2.0% |
| Tohono O'odham | 0.0 /100 | #338 | Tragic 2.2% |
| Immigrants | Azores | 0.0 /100 | #339 | Tragic 2.2% |
| Menominee | 0.0 /100 | #340 | Tragic 2.3% |
| Tsimshian | 0.0 /100 | #341 | Tragic 2.4% |
| Alaska Natives | 0.0 /100 | #342 | Tragic 2.9% |
| Colville | 0.0 /100 | #343 | Tragic 3.3% |
| Inupiat | 0.0 /100 | #344 | Tragic 3.7% |
| Paiute | 0.0 /100 | #345 | Tragic 3.9% |
| Yup'ik | 0.0 /100 | #346 | Tragic 4.5% |
| Hopi | 0.0 /100 | #347 | Tragic 4.6% |
Demographics Similar to Immigrants from Uganda by Disability Age Under 5
In terms of disability age under 5, the demographic groups most similar to Immigrants from Uganda are Immigrants from Morocco (1.2%, a difference of 0.060%), Immigrants from Nicaragua (1.2%, a difference of 0.060%), Nicaraguan (1.1%, a difference of 0.11%), Indonesian (1.2%, a difference of 0.12%), and Dominican (1.1%, a difference of 0.14%).
| Demographics | Rating | Rank | Disability Age Under 5 |
| Sri Lankans | 96.8 /100 | #94 | Exceptional 1.1% |
| Immigrants | Moldova | 96.8 /100 | #95 | Exceptional 1.1% |
| Mongolians | 96.6 /100 | #96 | Exceptional 1.1% |
| Immigrants | Iraq | 96.5 /100 | #97 | Exceptional 1.1% |
| Immigrants | South Eastern Asia | 96.5 /100 | #98 | Exceptional 1.1% |
| Dominicans | 96.3 /100 | #99 | Exceptional 1.1% |
| Nicaraguans | 96.3 /100 | #100 | Exceptional 1.1% |
| Immigrants | Uganda | 96.1 /100 | #101 | Exceptional 1.1% |
| Immigrants | Morocco | 96.0 /100 | #102 | Exceptional 1.2% |
| Immigrants | Nicaragua | 96.0 /100 | #103 | Exceptional 1.2% |
| Indonesians | 95.9 /100 | #104 | Exceptional 1.2% |
| Immigrants | South Africa | 95.6 /100 | #105 | Exceptional 1.2% |
| Cambodians | 95.4 /100 | #106 | Exceptional 1.2% |
| Immigrants | West Indies | 95.3 /100 | #107 | Exceptional 1.2% |
| Iraqis | 95.1 /100 | #108 | Exceptional 1.2% |