Iranian vs Crow Disability Age Under 5
COMPARE
Iranian
Crow
Disability Age Under 5
Disability Age Under 5 Comparison
Iranians
Crow
1.0%
DISABILITY AGE UNDER 5
99.9/ 100
METRIC RATING
32nd/ 347
METRIC RANK
1.2%
DISABILITY AGE UNDER 5
51.0/ 100
METRIC RATING
172nd/ 347
METRIC RANK
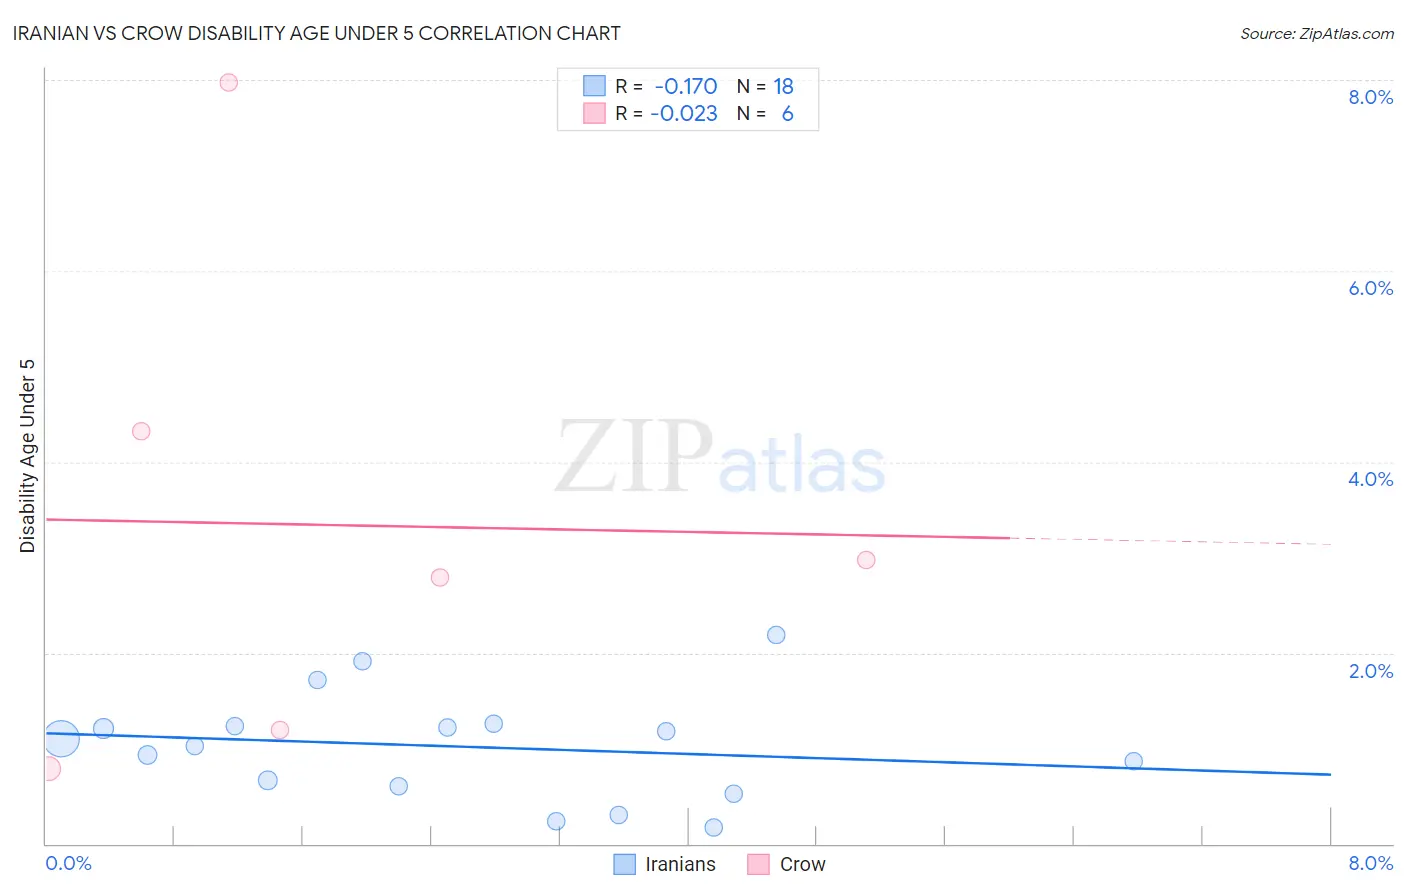
Iranian vs Crow Disability Age Under 5 Correlation Chart
The statistical analysis conducted on geographies consisting of 185,162,797 people shows a poor negative correlation between the proportion of Iranians and percentage of population with a disability under the age of 5 in the United States with a correlation coefficient (R) of -0.170 and weighted average of 1.0%. Similarly, the statistical analysis conducted on geographies consisting of 49,259,898 people shows no correlation between the proportion of Crow and percentage of population with a disability under the age of 5 in the United States with a correlation coefficient (R) of -0.023 and weighted average of 1.2%, a difference of 20.1%.
Disability Age Under 5 Correlation Summary
| Measurement | Iranian | Crow |
| Minimum | 0.17% | 0.78% |
| Maximum | 2.2% | 8.0% |
| Range | 2.0% | 7.2% |
| Mean | 1.0% | 3.3% |
| Median | 1.1% | 2.9% |
| Interquartile 25% (IQ1) | 0.60% | 1.2% |
| Interquartile 75% (IQ3) | 1.2% | 4.3% |
| Interquartile Range (IQR) | 0.63% | 3.1% |
| Standard Deviation (Sample) | 0.56% | 2.6% |
| Standard Deviation (Population) | 0.54% | 2.4% |
Similar Demographics by Disability Age Under 5
Demographics Similar to Iranians by Disability Age Under 5
In terms of disability age under 5, the demographic groups most similar to Iranians are Armenian (1.0%, a difference of 0.050%), Bolivian (1.0%, a difference of 0.17%), Immigrants from Ukraine (1.0%, a difference of 0.29%), Immigrants from South Central Asia (1.0%, a difference of 0.33%), and Barbadian (1.0%, a difference of 0.53%).
| Demographics | Rating | Rank | Disability Age Under 5 |
| Immigrants | Micronesia | 100.0 /100 | #25 | Exceptional 1.0% |
| Immigrants | Taiwan | 100.0 /100 | #26 | Exceptional 1.0% |
| Guyanese | 100.0 /100 | #27 | Exceptional 1.0% |
| Immigrants | Eastern Asia | 100.0 /100 | #28 | Exceptional 1.0% |
| Immigrants | Belarus | 100.0 /100 | #29 | Exceptional 1.0% |
| Immigrants | South Central Asia | 99.9 /100 | #30 | Exceptional 1.0% |
| Armenians | 99.9 /100 | #31 | Exceptional 1.0% |
| Iranians | 99.9 /100 | #32 | Exceptional 1.0% |
| Bolivians | 99.9 /100 | #33 | Exceptional 1.0% |
| Immigrants | Ukraine | 99.9 /100 | #34 | Exceptional 1.0% |
| Barbadians | 99.9 /100 | #35 | Exceptional 1.0% |
| Immigrants | Nepal | 99.9 /100 | #36 | Exceptional 1.0% |
| Immigrants | India | 99.9 /100 | #37 | Exceptional 1.0% |
| Immigrants | Guyana | 99.9 /100 | #38 | Exceptional 1.0% |
| Filipinos | 99.9 /100 | #39 | Exceptional 1.1% |
Demographics Similar to Crow by Disability Age Under 5
In terms of disability age under 5, the demographic groups most similar to Crow are Immigrants from Ireland (1.2%, a difference of 0.070%), Immigrants from Latvia (1.2%, a difference of 0.090%), Immigrants from Nigeria (1.2%, a difference of 0.090%), Immigrants from Kenya (1.2%, a difference of 0.22%), and Comanche (1.2%, a difference of 0.32%).
| Demographics | Rating | Rank | Disability Age Under 5 |
| Immigrants | Kuwait | 62.6 /100 | #165 | Good 1.2% |
| Immigrants | Central America | 61.4 /100 | #166 | Good 1.2% |
| Immigrants | Argentina | 60.2 /100 | #167 | Good 1.2% |
| Sierra Leoneans | 59.1 /100 | #168 | Average 1.2% |
| Immigrants | Uruguay | 59.0 /100 | #169 | Average 1.2% |
| Immigrants | Jamaica | 58.8 /100 | #170 | Average 1.2% |
| Guamanians/Chamorros | 57.8 /100 | #171 | Average 1.2% |
| Crow | 51.0 /100 | #172 | Average 1.2% |
| Immigrants | Ireland | 50.3 /100 | #173 | Average 1.2% |
| Immigrants | Latvia | 50.0 /100 | #174 | Average 1.2% |
| Immigrants | Nigeria | 50.0 /100 | #175 | Average 1.2% |
| Immigrants | Kenya | 48.6 /100 | #176 | Average 1.2% |
| Comanche | 47.5 /100 | #177 | Average 1.2% |
| Venezuelans | 47.1 /100 | #178 | Average 1.2% |
| Immigrants | Bahamas | 45.2 /100 | #179 | Average 1.2% |