Immigrants from Grenada vs Immigrants from Uganda Disability Age Under 5
COMPARE
Immigrants from Grenada
Immigrants from Uganda
Disability Age Under 5
Disability Age Under 5 Comparison
Immigrants from Grenada
Immigrants from Uganda
0.94%
DISABILITY AGE UNDER 5
100.0/ 100
METRIC RATING
12th/ 347
METRIC RANK
1.1%
DISABILITY AGE UNDER 5
96.1/ 100
METRIC RATING
101st/ 347
METRIC RANK
Immigrants from Grenada vs Immigrants from Uganda Disability Age Under 5 Correlation Chart
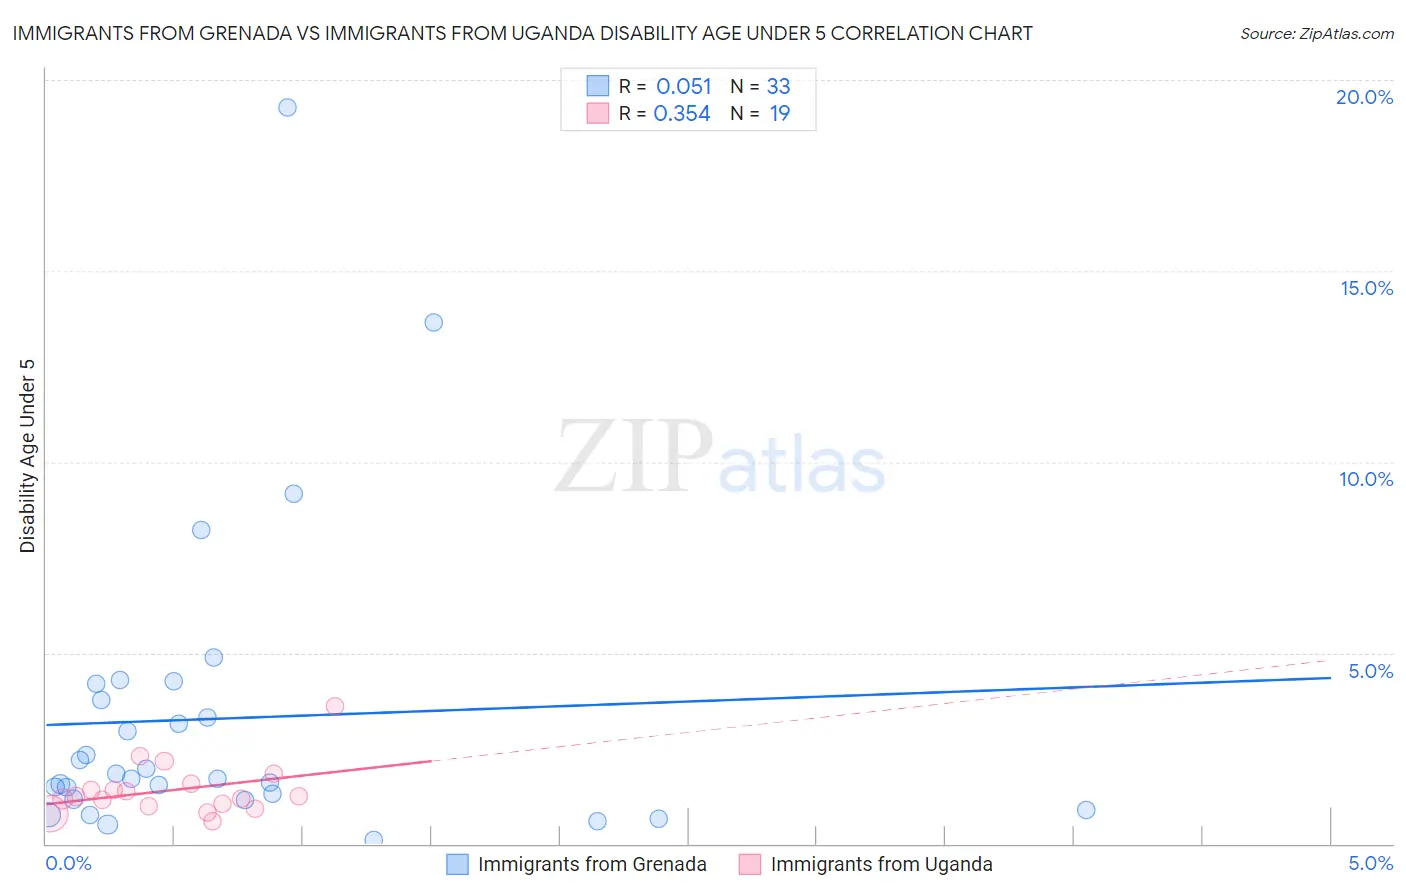
The statistical analysis conducted on geographies consisting of 49,697,157 people shows a slight positive correlation between the proportion of Immigrants from Grenada and percentage of population with a disability under the age of 5 in the United States with a correlation coefficient (R) of 0.051 and weighted average of 0.94%. Similarly, the statistical analysis conducted on geographies consisting of 93,852,660 people shows a mild positive correlation between the proportion of Immigrants from Uganda and percentage of population with a disability under the age of 5 in the United States with a correlation coefficient (R) of 0.354 and weighted average of 1.1%, a difference of 21.8%.
Disability Age Under 5 Correlation Summary
| Measurement | Immigrants from Grenada | Immigrants from Uganda |
| Minimum | 0.086% | 0.59% |
| Maximum | 19.3% | 3.6% |
| Range | 19.2% | 3.0% |
| Mean | 3.3% | 1.4% |
| Median | 1.7% | 1.2% |
| Interquartile 25% (IQ1) | 1.1% | 0.98% |
| Interquartile 75% (IQ3) | 4.0% | 1.6% |
| Interquartile Range (IQR) | 2.8% | 0.59% |
| Standard Deviation (Sample) | 4.0% | 0.69% |
| Standard Deviation (Population) | 4.0% | 0.67% |
Similar Demographics by Disability Age Under 5
Demographics Similar to Immigrants from Grenada by Disability Age Under 5
In terms of disability age under 5, the demographic groups most similar to Immigrants from Grenada are Afghan (0.94%, a difference of 0.020%), Soviet Union (0.95%, a difference of 0.17%), Yuman (0.95%, a difference of 0.24%), Immigrants from Hong Kong (0.95%, a difference of 0.28%), and Marshallese (0.94%, a difference of 0.78%).
| Demographics | Rating | Rank | Disability Age Under 5 |
| Immigrants | Bangladesh | 100.0 /100 | #5 | Exceptional 0.85% |
| Ute | 100.0 /100 | #6 | Exceptional 0.86% |
| Immigrants | Afghanistan | 100.0 /100 | #7 | Exceptional 0.91% |
| Immigrants | Yemen | 100.0 /100 | #8 | Exceptional 0.91% |
| Immigrants | Fiji | 100.0 /100 | #9 | Exceptional 0.92% |
| Marshallese | 100.0 /100 | #10 | Exceptional 0.94% |
| Afghans | 100.0 /100 | #11 | Exceptional 0.94% |
| Immigrants | Grenada | 100.0 /100 | #12 | Exceptional 0.94% |
| Soviet Union | 100.0 /100 | #13 | Exceptional 0.95% |
| Yuman | 100.0 /100 | #14 | Exceptional 0.95% |
| Immigrants | Hong Kong | 100.0 /100 | #15 | Exceptional 0.95% |
| Immigrants | Israel | 100.0 /100 | #16 | Exceptional 0.96% |
| Immigrants | China | 100.0 /100 | #17 | Exceptional 0.96% |
| Immigrants | Barbados | 100.0 /100 | #18 | Exceptional 0.97% |
| Puget Sound Salish | 100.0 /100 | #19 | Exceptional 0.97% |
Demographics Similar to Immigrants from Uganda by Disability Age Under 5
In terms of disability age under 5, the demographic groups most similar to Immigrants from Uganda are Immigrants from Morocco (1.2%, a difference of 0.060%), Immigrants from Nicaragua (1.2%, a difference of 0.060%), Nicaraguan (1.1%, a difference of 0.11%), Indonesian (1.2%, a difference of 0.12%), and Dominican (1.1%, a difference of 0.14%).
| Demographics | Rating | Rank | Disability Age Under 5 |
| Sri Lankans | 96.8 /100 | #94 | Exceptional 1.1% |
| Immigrants | Moldova | 96.8 /100 | #95 | Exceptional 1.1% |
| Mongolians | 96.6 /100 | #96 | Exceptional 1.1% |
| Immigrants | Iraq | 96.5 /100 | #97 | Exceptional 1.1% |
| Immigrants | South Eastern Asia | 96.5 /100 | #98 | Exceptional 1.1% |
| Dominicans | 96.3 /100 | #99 | Exceptional 1.1% |
| Nicaraguans | 96.3 /100 | #100 | Exceptional 1.1% |
| Immigrants | Uganda | 96.1 /100 | #101 | Exceptional 1.1% |
| Immigrants | Morocco | 96.0 /100 | #102 | Exceptional 1.2% |
| Immigrants | Nicaragua | 96.0 /100 | #103 | Exceptional 1.2% |
| Indonesians | 95.9 /100 | #104 | Exceptional 1.2% |
| Immigrants | South Africa | 95.6 /100 | #105 | Exceptional 1.2% |
| Cambodians | 95.4 /100 | #106 | Exceptional 1.2% |
| Immigrants | West Indies | 95.3 /100 | #107 | Exceptional 1.2% |
| Iraqis | 95.1 /100 | #108 | Exceptional 1.2% |