Iranian vs Palestinian Disability Age Under 5
COMPARE
Iranian
Palestinian
Disability Age Under 5
Disability Age Under 5 Comparison
Iranians
Palestinians
1.0%
DISABILITY AGE UNDER 5
99.9/ 100
METRIC RATING
32nd/ 347
METRIC RANK
1.2%
DISABILITY AGE UNDER 5
43.0/ 100
METRIC RATING
184th/ 347
METRIC RANK
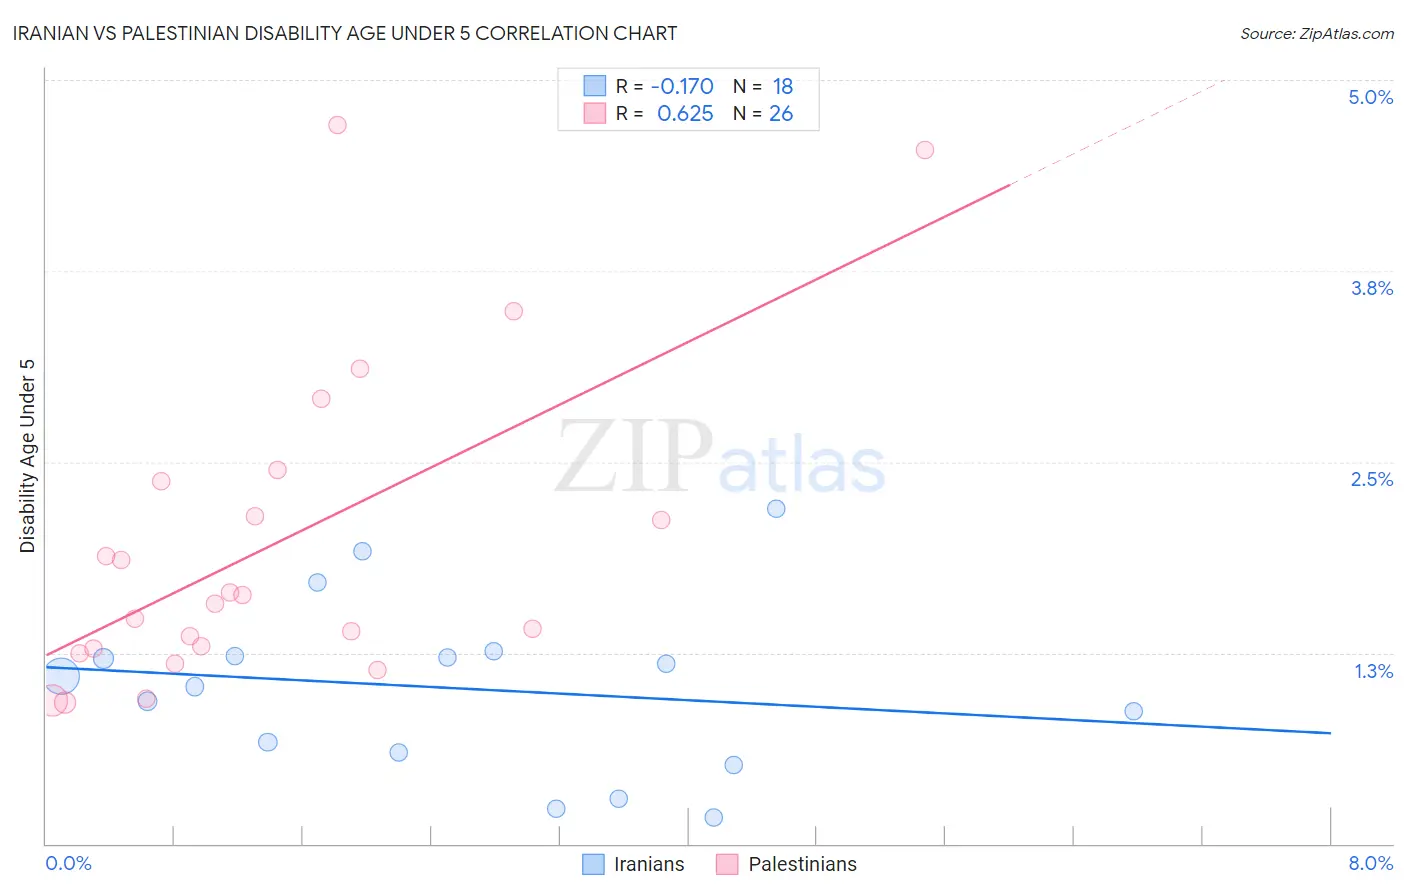
Iranian vs Palestinian Disability Age Under 5 Correlation Chart
The statistical analysis conducted on geographies consisting of 185,162,797 people shows a poor negative correlation between the proportion of Iranians and percentage of population with a disability under the age of 5 in the United States with a correlation coefficient (R) of -0.170 and weighted average of 1.0%. Similarly, the statistical analysis conducted on geographies consisting of 140,188,705 people shows a significant positive correlation between the proportion of Palestinians and percentage of population with a disability under the age of 5 in the United States with a correlation coefficient (R) of 0.625 and weighted average of 1.2%, a difference of 21.0%.
Disability Age Under 5 Correlation Summary
| Measurement | Iranian | Palestinian |
| Minimum | 0.17% | 0.93% |
| Maximum | 2.2% | 4.7% |
| Range | 2.0% | 3.8% |
| Mean | 1.0% | 2.0% |
| Median | 1.1% | 1.6% |
| Interquartile 25% (IQ1) | 0.60% | 1.3% |
| Interquartile 75% (IQ3) | 1.2% | 2.4% |
| Interquartile Range (IQR) | 0.63% | 1.1% |
| Standard Deviation (Sample) | 0.56% | 1.0% |
| Standard Deviation (Population) | 0.54% | 1.0% |
Similar Demographics by Disability Age Under 5
Demographics Similar to Iranians by Disability Age Under 5
In terms of disability age under 5, the demographic groups most similar to Iranians are Armenian (1.0%, a difference of 0.050%), Bolivian (1.0%, a difference of 0.17%), Immigrants from Ukraine (1.0%, a difference of 0.29%), Immigrants from South Central Asia (1.0%, a difference of 0.33%), and Barbadian (1.0%, a difference of 0.53%).
| Demographics | Rating | Rank | Disability Age Under 5 |
| Immigrants | Micronesia | 100.0 /100 | #25 | Exceptional 1.0% |
| Immigrants | Taiwan | 100.0 /100 | #26 | Exceptional 1.0% |
| Guyanese | 100.0 /100 | #27 | Exceptional 1.0% |
| Immigrants | Eastern Asia | 100.0 /100 | #28 | Exceptional 1.0% |
| Immigrants | Belarus | 100.0 /100 | #29 | Exceptional 1.0% |
| Immigrants | South Central Asia | 99.9 /100 | #30 | Exceptional 1.0% |
| Armenians | 99.9 /100 | #31 | Exceptional 1.0% |
| Iranians | 99.9 /100 | #32 | Exceptional 1.0% |
| Bolivians | 99.9 /100 | #33 | Exceptional 1.0% |
| Immigrants | Ukraine | 99.9 /100 | #34 | Exceptional 1.0% |
| Barbadians | 99.9 /100 | #35 | Exceptional 1.0% |
| Immigrants | Nepal | 99.9 /100 | #36 | Exceptional 1.0% |
| Immigrants | India | 99.9 /100 | #37 | Exceptional 1.0% |
| Immigrants | Guyana | 99.9 /100 | #38 | Exceptional 1.0% |
| Filipinos | 99.9 /100 | #39 | Exceptional 1.1% |
Demographics Similar to Palestinians by Disability Age Under 5
In terms of disability age under 5, the demographic groups most similar to Palestinians are Immigrants from Saudi Arabia (1.2%, a difference of 0.020%), Immigrants from Western Africa (1.2%, a difference of 0.050%), Cuban (1.2%, a difference of 0.050%), Macedonian (1.2%, a difference of 0.060%), and Immigrants from Peru (1.2%, a difference of 0.060%).
| Demographics | Rating | Rank | Disability Age Under 5 |
| Comanche | 47.5 /100 | #177 | Average 1.2% |
| Venezuelans | 47.1 /100 | #178 | Average 1.2% |
| Immigrants | Bahamas | 45.2 /100 | #179 | Average 1.2% |
| Immigrants | Mexico | 44.4 /100 | #180 | Average 1.2% |
| Macedonians | 43.7 /100 | #181 | Average 1.2% |
| Immigrants | Peru | 43.7 /100 | #181 | Average 1.2% |
| Immigrants | Saudi Arabia | 43.3 /100 | #183 | Average 1.2% |
| Palestinians | 43.0 /100 | #184 | Average 1.2% |
| Immigrants | Western Africa | 42.5 /100 | #185 | Average 1.2% |
| Cubans | 42.5 /100 | #186 | Average 1.2% |
| Immigrants | Haiti | 40.2 /100 | #187 | Average 1.3% |
| Haitians | 39.9 /100 | #188 | Fair 1.3% |
| Peruvians | 37.6 /100 | #189 | Fair 1.3% |
| Immigrants | Laos | 36.6 /100 | #190 | Fair 1.3% |
| Mexican American Indians | 36.6 /100 | #191 | Fair 1.3% |