Iranian vs Immigrants from France Disability Age Under 5
COMPARE
Iranian
Immigrants from France
Disability Age Under 5
Disability Age Under 5 Comparison
Iranians
Immigrants from France
1.0%
DISABILITY AGE UNDER 5
99.9/ 100
METRIC RATING
32nd/ 347
METRIC RANK
1.2%
DISABILITY AGE UNDER 5
88.4/ 100
METRIC RATING
128th/ 347
METRIC RANK
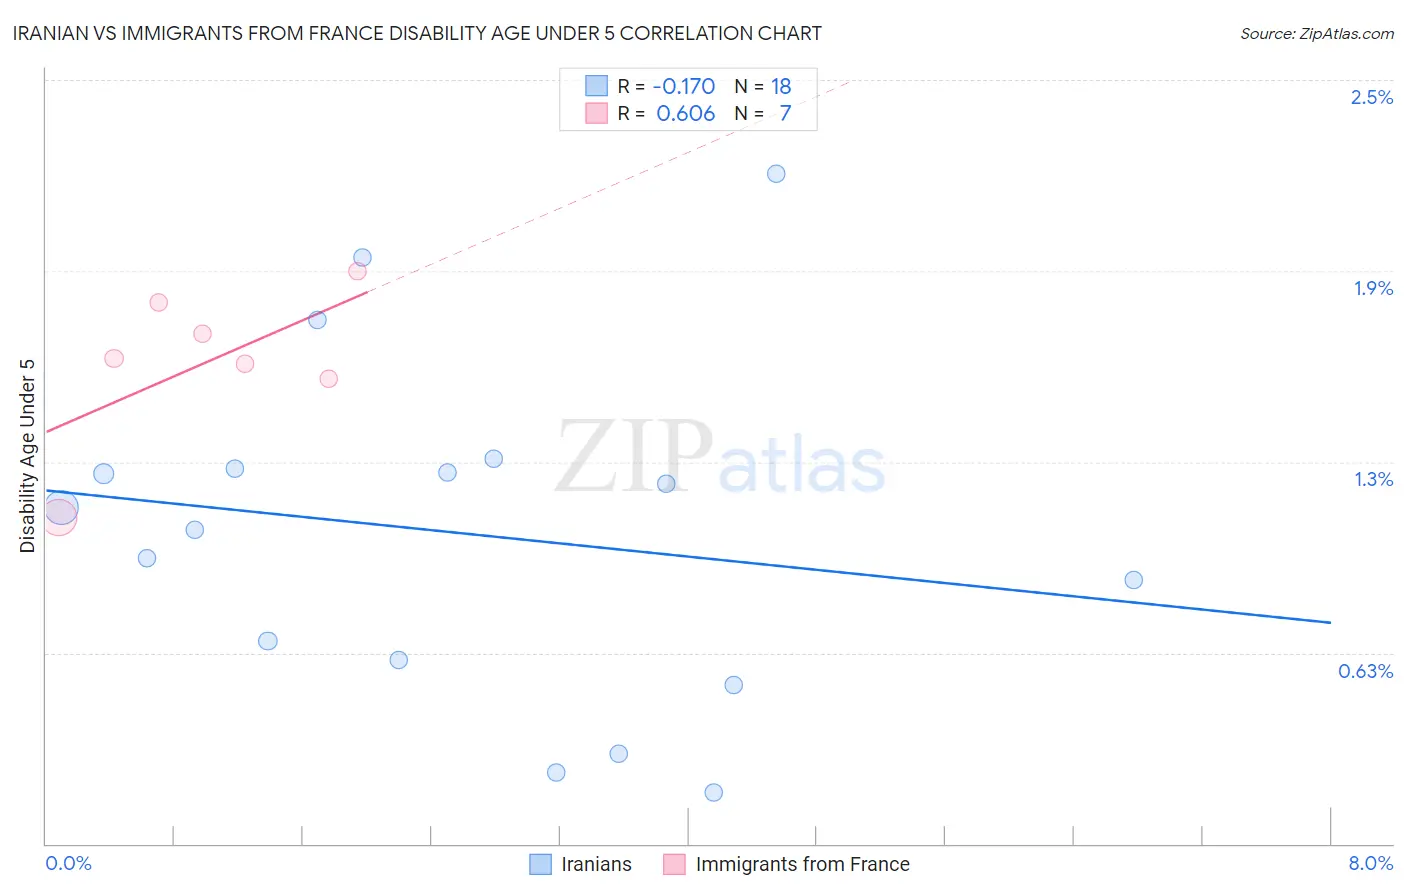
Iranian vs Immigrants from France Disability Age Under 5 Correlation Chart
The statistical analysis conducted on geographies consisting of 185,162,797 people shows a poor negative correlation between the proportion of Iranians and percentage of population with a disability under the age of 5 in the United States with a correlation coefficient (R) of -0.170 and weighted average of 1.0%. Similarly, the statistical analysis conducted on geographies consisting of 171,123,131 people shows a significant positive correlation between the proportion of Immigrants from France and percentage of population with a disability under the age of 5 in the United States with a correlation coefficient (R) of 0.606 and weighted average of 1.2%, a difference of 14.7%.
Disability Age Under 5 Correlation Summary
| Measurement | Iranian | Immigrants from France |
| Minimum | 0.17% | 1.1% |
| Maximum | 2.2% | 1.9% |
| Range | 2.0% | 0.81% |
| Mean | 1.0% | 1.6% |
| Median | 1.1% | 1.6% |
| Interquartile 25% (IQ1) | 0.60% | 1.5% |
| Interquartile 75% (IQ3) | 1.2% | 1.8% |
| Interquartile Range (IQR) | 0.63% | 0.25% |
| Standard Deviation (Sample) | 0.56% | 0.26% |
| Standard Deviation (Population) | 0.54% | 0.24% |
Similar Demographics by Disability Age Under 5
Demographics Similar to Iranians by Disability Age Under 5
In terms of disability age under 5, the demographic groups most similar to Iranians are Armenian (1.0%, a difference of 0.050%), Bolivian (1.0%, a difference of 0.17%), Immigrants from Ukraine (1.0%, a difference of 0.29%), Immigrants from South Central Asia (1.0%, a difference of 0.33%), and Barbadian (1.0%, a difference of 0.53%).
| Demographics | Rating | Rank | Disability Age Under 5 |
| Immigrants | Micronesia | 100.0 /100 | #25 | Exceptional 1.0% |
| Immigrants | Taiwan | 100.0 /100 | #26 | Exceptional 1.0% |
| Guyanese | 100.0 /100 | #27 | Exceptional 1.0% |
| Immigrants | Eastern Asia | 100.0 /100 | #28 | Exceptional 1.0% |
| Immigrants | Belarus | 100.0 /100 | #29 | Exceptional 1.0% |
| Immigrants | South Central Asia | 99.9 /100 | #30 | Exceptional 1.0% |
| Armenians | 99.9 /100 | #31 | Exceptional 1.0% |
| Iranians | 99.9 /100 | #32 | Exceptional 1.0% |
| Bolivians | 99.9 /100 | #33 | Exceptional 1.0% |
| Immigrants | Ukraine | 99.9 /100 | #34 | Exceptional 1.0% |
| Barbadians | 99.9 /100 | #35 | Exceptional 1.0% |
| Immigrants | Nepal | 99.9 /100 | #36 | Exceptional 1.0% |
| Immigrants | India | 99.9 /100 | #37 | Exceptional 1.0% |
| Immigrants | Guyana | 99.9 /100 | #38 | Exceptional 1.0% |
| Filipinos | 99.9 /100 | #39 | Exceptional 1.1% |
Demographics Similar to Immigrants from France by Disability Age Under 5
In terms of disability age under 5, the demographic groups most similar to Immigrants from France are Immigrants from Romania (1.2%, a difference of 0.0%), Immigrants (1.2%, a difference of 0.090%), Korean (1.2%, a difference of 0.17%), Immigrants from Serbia (1.2%, a difference of 0.19%), and Immigrants from Eastern Europe (1.2%, a difference of 0.25%).
| Demographics | Rating | Rank | Disability Age Under 5 |
| Immigrants | Senegal | 91.4 /100 | #121 | Exceptional 1.2% |
| Aleuts | 90.7 /100 | #122 | Exceptional 1.2% |
| Zimbabweans | 90.6 /100 | #123 | Exceptional 1.2% |
| Immigrants | Cambodia | 90.5 /100 | #124 | Exceptional 1.2% |
| Japanese | 90.3 /100 | #125 | Exceptional 1.2% |
| Central Americans | 89.7 /100 | #126 | Excellent 1.2% |
| Immigrants | Romania | 88.4 /100 | #127 | Excellent 1.2% |
| Immigrants | France | 88.4 /100 | #128 | Excellent 1.2% |
| Immigrants | Immigrants | 88.0 /100 | #129 | Excellent 1.2% |
| Koreans | 87.7 /100 | #130 | Excellent 1.2% |
| Immigrants | Serbia | 87.6 /100 | #131 | Excellent 1.2% |
| Immigrants | Eastern Europe | 87.3 /100 | #132 | Excellent 1.2% |
| Immigrants | Spain | 86.5 /100 | #133 | Excellent 1.2% |
| Argentineans | 85.7 /100 | #134 | Excellent 1.2% |
| Fijians | 84.7 /100 | #135 | Excellent 1.2% |