Iranian vs Immigrants from Sri Lanka Disability Age Under 5
COMPARE
Iranian
Immigrants from Sri Lanka
Disability Age Under 5
Disability Age Under 5 Comparison
Iranians
Immigrants from Sri Lanka
1.0%
DISABILITY AGE UNDER 5
99.9/ 100
METRIC RATING
32nd/ 347
METRIC RANK
1.1%
DISABILITY AGE UNDER 5
98.5/ 100
METRIC RATING
73rd/ 347
METRIC RANK
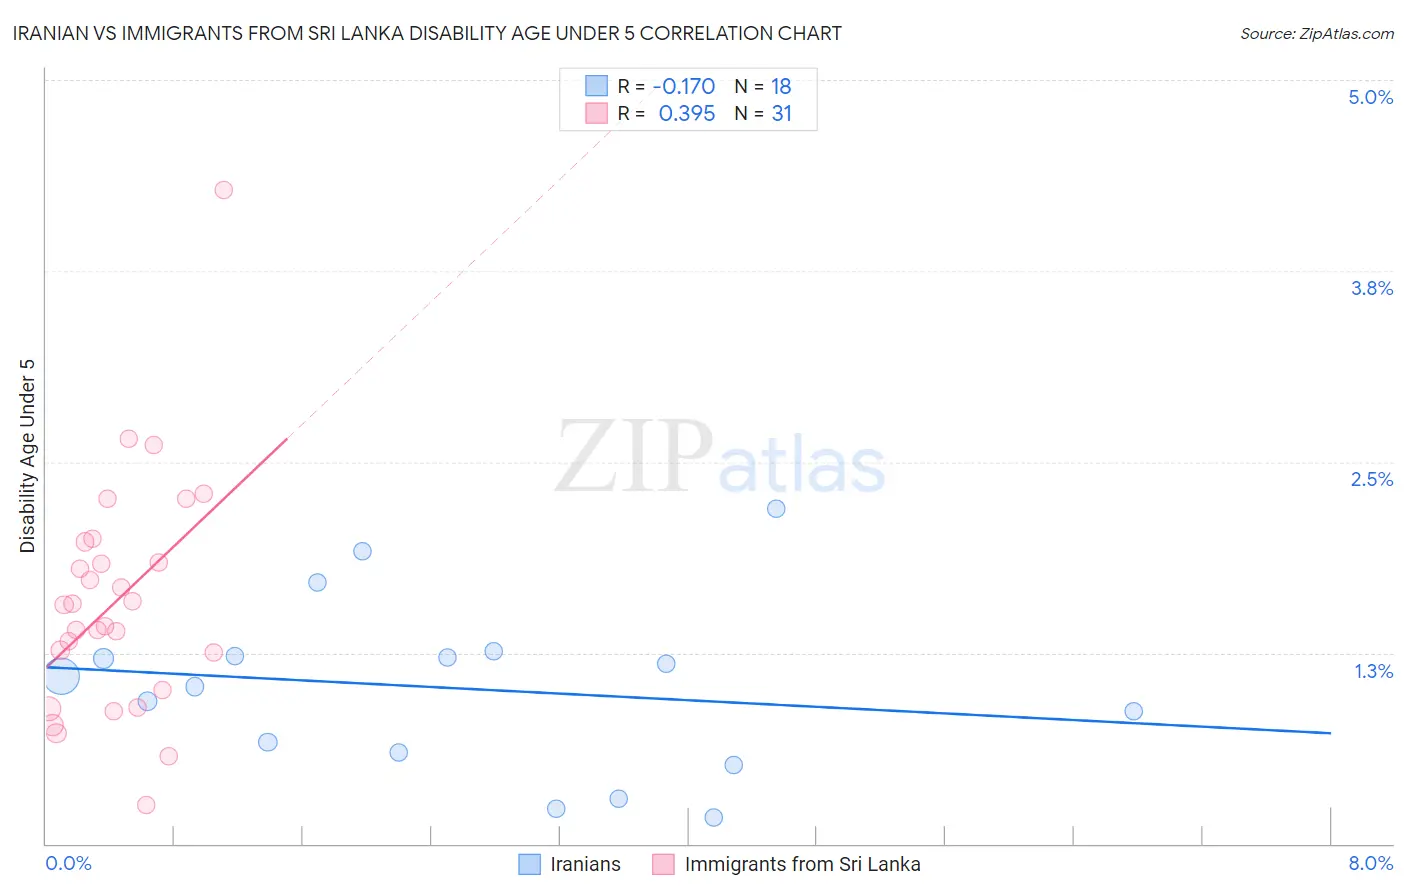
Iranian vs Immigrants from Sri Lanka Disability Age Under 5 Correlation Chart
The statistical analysis conducted on geographies consisting of 185,162,797 people shows a poor negative correlation between the proportion of Iranians and percentage of population with a disability under the age of 5 in the United States with a correlation coefficient (R) of -0.170 and weighted average of 1.0%. Similarly, the statistical analysis conducted on geographies consisting of 104,720,204 people shows a mild positive correlation between the proportion of Immigrants from Sri Lanka and percentage of population with a disability under the age of 5 in the United States with a correlation coefficient (R) of 0.395 and weighted average of 1.1%, a difference of 8.9%.
Disability Age Under 5 Correlation Summary
| Measurement | Iranian | Immigrants from Sri Lanka |
| Minimum | 0.17% | 0.25% |
| Maximum | 2.2% | 4.3% |
| Range | 2.0% | 4.0% |
| Mean | 1.0% | 1.6% |
| Median | 1.1% | 1.6% |
| Interquartile 25% (IQ1) | 0.60% | 1.0% |
| Interquartile 75% (IQ3) | 1.2% | 2.0% |
| Interquartile Range (IQR) | 0.63% | 0.97% |
| Standard Deviation (Sample) | 0.56% | 0.77% |
| Standard Deviation (Population) | 0.54% | 0.76% |
Similar Demographics by Disability Age Under 5
Demographics Similar to Iranians by Disability Age Under 5
In terms of disability age under 5, the demographic groups most similar to Iranians are Armenian (1.0%, a difference of 0.050%), Bolivian (1.0%, a difference of 0.17%), Immigrants from Ukraine (1.0%, a difference of 0.29%), Immigrants from South Central Asia (1.0%, a difference of 0.33%), and Barbadian (1.0%, a difference of 0.53%).
| Demographics | Rating | Rank | Disability Age Under 5 |
| Immigrants | Micronesia | 100.0 /100 | #25 | Exceptional 1.0% |
| Immigrants | Taiwan | 100.0 /100 | #26 | Exceptional 1.0% |
| Guyanese | 100.0 /100 | #27 | Exceptional 1.0% |
| Immigrants | Eastern Asia | 100.0 /100 | #28 | Exceptional 1.0% |
| Immigrants | Belarus | 100.0 /100 | #29 | Exceptional 1.0% |
| Immigrants | South Central Asia | 99.9 /100 | #30 | Exceptional 1.0% |
| Armenians | 99.9 /100 | #31 | Exceptional 1.0% |
| Iranians | 99.9 /100 | #32 | Exceptional 1.0% |
| Bolivians | 99.9 /100 | #33 | Exceptional 1.0% |
| Immigrants | Ukraine | 99.9 /100 | #34 | Exceptional 1.0% |
| Barbadians | 99.9 /100 | #35 | Exceptional 1.0% |
| Immigrants | Nepal | 99.9 /100 | #36 | Exceptional 1.0% |
| Immigrants | India | 99.9 /100 | #37 | Exceptional 1.0% |
| Immigrants | Guyana | 99.9 /100 | #38 | Exceptional 1.0% |
| Filipinos | 99.9 /100 | #39 | Exceptional 1.1% |
Demographics Similar to Immigrants from Sri Lanka by Disability Age Under 5
In terms of disability age under 5, the demographic groups most similar to Immigrants from Sri Lanka are Jordanian (1.1%, a difference of 0.0%), Burmese (1.1%, a difference of 0.080%), Immigrants from Pakistan (1.1%, a difference of 0.090%), Trinidadian and Tobagonian (1.1%, a difference of 0.24%), and Immigrants from Ecuador (1.1%, a difference of 0.30%).
| Demographics | Rating | Rank | Disability Age Under 5 |
| Immigrants | Indonesia | 98.7 /100 | #66 | Exceptional 1.1% |
| Immigrants | Belize | 98.7 /100 | #67 | Exceptional 1.1% |
| South Africans | 98.7 /100 | #68 | Exceptional 1.1% |
| Israelis | 98.7 /100 | #69 | Exceptional 1.1% |
| Immigrants | Ecuador | 98.6 /100 | #70 | Exceptional 1.1% |
| Trinidadians and Tobagonians | 98.6 /100 | #71 | Exceptional 1.1% |
| Burmese | 98.5 /100 | #72 | Exceptional 1.1% |
| Immigrants | Sri Lanka | 98.5 /100 | #73 | Exceptional 1.1% |
| Jordanians | 98.5 /100 | #74 | Exceptional 1.1% |
| Immigrants | Pakistan | 98.4 /100 | #75 | Exceptional 1.1% |
| Immigrants | Burma/Myanmar | 98.2 /100 | #76 | Exceptional 1.1% |
| Immigrants | Denmark | 98.1 /100 | #77 | Exceptional 1.1% |
| West Indians | 98.0 /100 | #78 | Exceptional 1.1% |
| Hmong | 98.0 /100 | #79 | Exceptional 1.1% |
| Immigrants | Trinidad and Tobago | 98.0 /100 | #80 | Exceptional 1.1% |