Immigrants from Bulgaria vs Immigrants from Turkey Cognitive Disability
COMPARE
Immigrants from Bulgaria
Immigrants from Turkey
Cognitive Disability
Cognitive Disability Comparison
Immigrants from Bulgaria
Immigrants from Turkey
16.7%
COGNITIVE DISABILITY
99.3/ 100
METRIC RATING
79th/ 347
METRIC RANK
17.2%
COGNITIVE DISABILITY
56.7/ 100
METRIC RATING
172nd/ 347
METRIC RANK
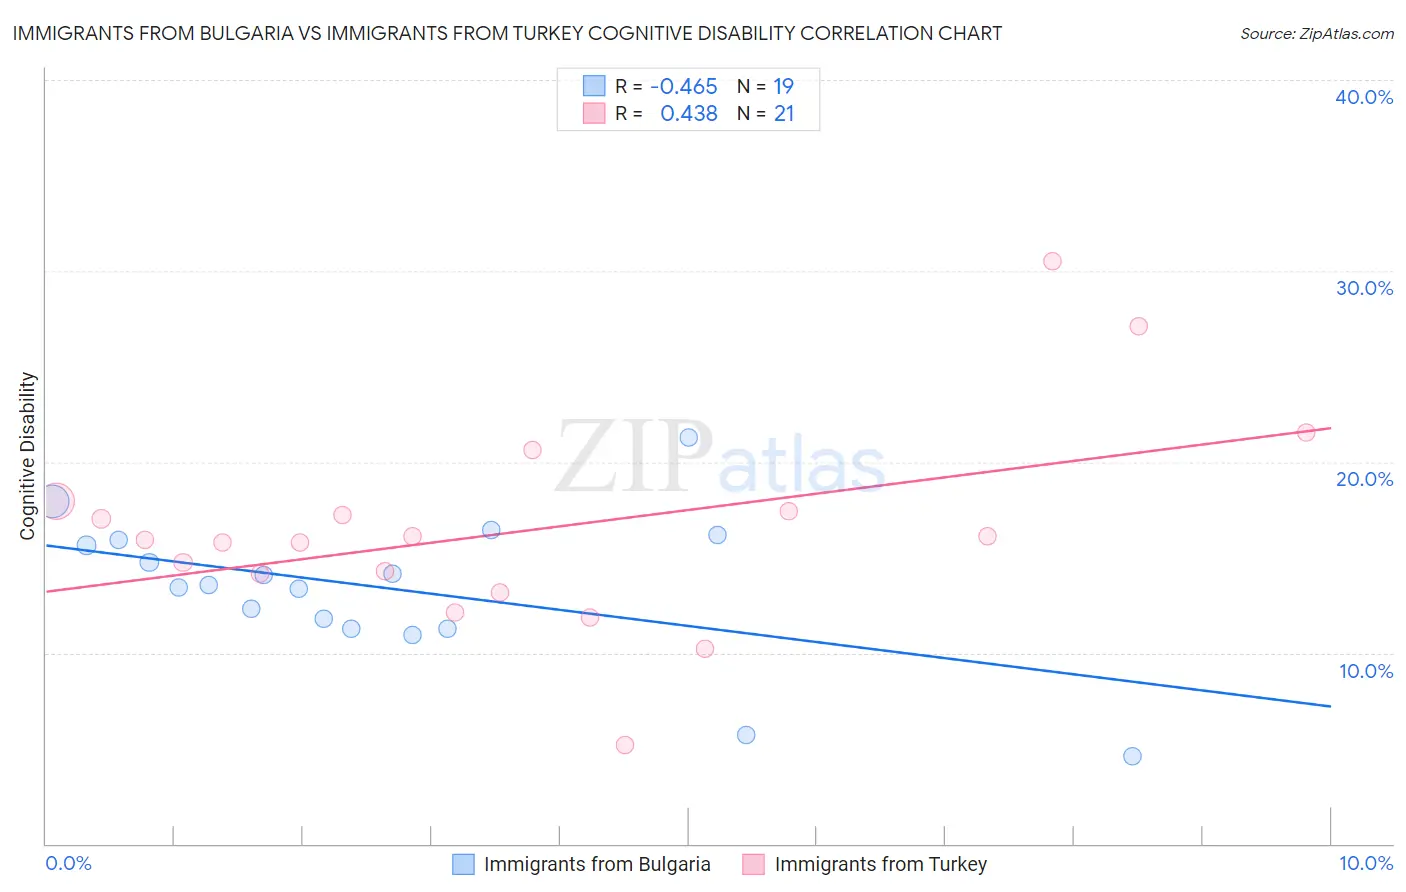
Immigrants from Bulgaria vs Immigrants from Turkey Cognitive Disability Correlation Chart
The statistical analysis conducted on geographies consisting of 172,549,844 people shows a moderate negative correlation between the proportion of Immigrants from Bulgaria and percentage of population with cognitive disability in the United States with a correlation coefficient (R) of -0.465 and weighted average of 16.7%. Similarly, the statistical analysis conducted on geographies consisting of 223,051,603 people shows a moderate positive correlation between the proportion of Immigrants from Turkey and percentage of population with cognitive disability in the United States with a correlation coefficient (R) of 0.438 and weighted average of 17.2%, a difference of 3.4%.
Cognitive Disability Correlation Summary
| Measurement | Immigrants from Bulgaria | Immigrants from Turkey |
| Minimum | 4.6% | 5.2% |
| Maximum | 21.3% | 30.5% |
| Range | 16.7% | 25.3% |
| Mean | 13.4% | 16.4% |
| Median | 13.5% | 15.9% |
| Interquartile 25% (IQ1) | 11.3% | 13.7% |
| Interquartile 75% (IQ3) | 15.9% | 17.7% |
| Interquartile Range (IQR) | 4.6% | 4.0% |
| Standard Deviation (Sample) | 3.9% | 5.4% |
| Standard Deviation (Population) | 3.8% | 5.3% |
Similar Demographics by Cognitive Disability
Demographics Similar to Immigrants from Bulgaria by Cognitive Disability
In terms of cognitive disability, the demographic groups most similar to Immigrants from Bulgaria are Immigrants from Hungary (16.7%, a difference of 0.010%), Peruvian (16.7%, a difference of 0.010%), Immigrants from Serbia (16.7%, a difference of 0.020%), Egyptian (16.7%, a difference of 0.030%), and Estonian (16.7%, a difference of 0.040%).
| Demographics | Rating | Rank | Cognitive Disability |
| Germans | 99.3 /100 | #72 | Exceptional 16.7% |
| Burmese | 99.3 /100 | #73 | Exceptional 16.7% |
| Slavs | 99.3 /100 | #74 | Exceptional 16.7% |
| Estonians | 99.3 /100 | #75 | Exceptional 16.7% |
| Immigrants | Serbia | 99.3 /100 | #76 | Exceptional 16.7% |
| Immigrants | Hungary | 99.3 /100 | #77 | Exceptional 16.7% |
| Peruvians | 99.3 /100 | #78 | Exceptional 16.7% |
| Immigrants | Bulgaria | 99.3 /100 | #79 | Exceptional 16.7% |
| Egyptians | 99.2 /100 | #80 | Exceptional 16.7% |
| Immigrants | Netherlands | 99.2 /100 | #81 | Exceptional 16.7% |
| Swiss | 99.2 /100 | #82 | Exceptional 16.7% |
| Serbians | 99.1 /100 | #83 | Exceptional 16.7% |
| Belgians | 99.1 /100 | #84 | Exceptional 16.7% |
| Immigrants | Moldova | 99.1 /100 | #85 | Exceptional 16.7% |
| Immigrants | South Africa | 99.0 /100 | #86 | Exceptional 16.7% |
Demographics Similar to Immigrants from Turkey by Cognitive Disability
In terms of cognitive disability, the demographic groups most similar to Immigrants from Turkey are Tlingit-Haida (17.2%, a difference of 0.080%), Ecuadorian (17.2%, a difference of 0.090%), Immigrants from Portugal (17.2%, a difference of 0.15%), Immigrants (17.2%, a difference of 0.17%), and Immigrants from Northern Africa (17.3%, a difference of 0.18%).
| Demographics | Rating | Rank | Cognitive Disability |
| Immigrants | Albania | 64.9 /100 | #165 | Good 17.2% |
| Immigrants | Ecuador | 64.4 /100 | #166 | Good 17.2% |
| Immigrants | Syria | 63.5 /100 | #167 | Good 17.2% |
| Immigrants | Immigrants | 62.5 /100 | #168 | Good 17.2% |
| Immigrants | Portugal | 61.8 /100 | #169 | Good 17.2% |
| Ecuadorians | 59.6 /100 | #170 | Average 17.2% |
| Tlingit-Haida | 59.4 /100 | #171 | Average 17.2% |
| Immigrants | Turkey | 56.7 /100 | #172 | Average 17.2% |
| Immigrants | Northern Africa | 50.2 /100 | #173 | Average 17.3% |
| Laotians | 50.0 /100 | #174 | Average 17.3% |
| Tsimshian | 49.8 /100 | #175 | Average 17.3% |
| Shoshone | 49.2 /100 | #176 | Average 17.3% |
| Ute | 49.1 /100 | #177 | Average 17.3% |
| Spanish | 48.9 /100 | #178 | Average 17.3% |
| Sioux | 48.6 /100 | #179 | Average 17.3% |