Immigrants from Indonesia vs Immigrants from Turkey Cognitive Disability
COMPARE
Immigrants from Indonesia
Immigrants from Turkey
Cognitive Disability
Cognitive Disability Comparison
Immigrants from Indonesia
Immigrants from Turkey
17.1%
COGNITIVE DISABILITY
82.7/ 100
METRIC RATING
152nd/ 347
METRIC RANK
17.2%
COGNITIVE DISABILITY
56.7/ 100
METRIC RATING
172nd/ 347
METRIC RANK
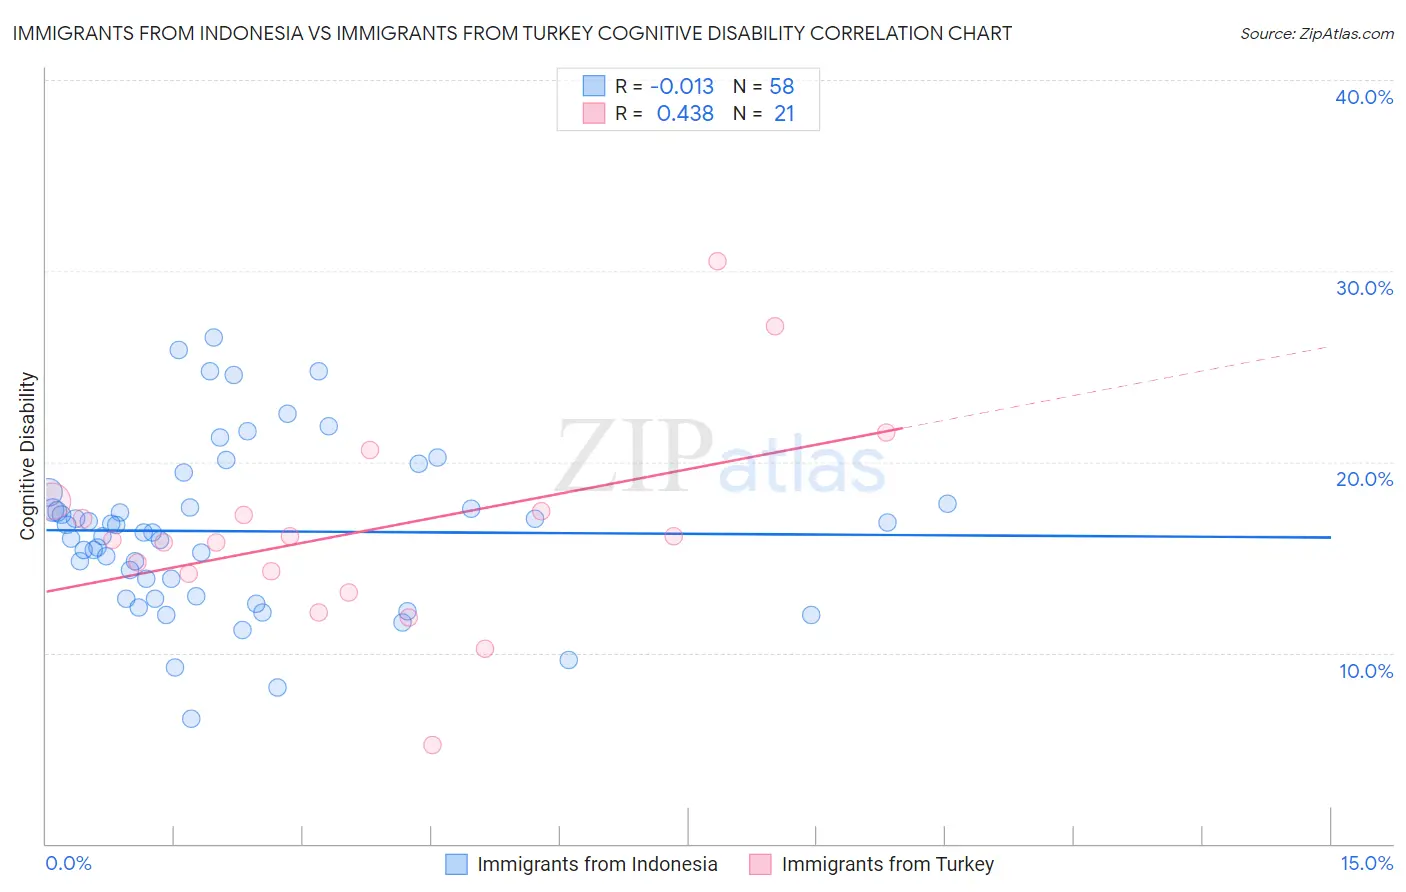
Immigrants from Indonesia vs Immigrants from Turkey Cognitive Disability Correlation Chart
The statistical analysis conducted on geographies consisting of 215,789,545 people shows no correlation between the proportion of Immigrants from Indonesia and percentage of population with cognitive disability in the United States with a correlation coefficient (R) of -0.013 and weighted average of 17.1%. Similarly, the statistical analysis conducted on geographies consisting of 223,051,603 people shows a moderate positive correlation between the proportion of Immigrants from Turkey and percentage of population with cognitive disability in the United States with a correlation coefficient (R) of 0.438 and weighted average of 17.2%, a difference of 0.93%.
Cognitive Disability Correlation Summary
| Measurement | Immigrants from Indonesia | Immigrants from Turkey |
| Minimum | 6.5% | 5.2% |
| Maximum | 26.5% | 30.5% |
| Range | 20.0% | 25.3% |
| Mean | 16.4% | 16.4% |
| Median | 16.3% | 15.9% |
| Interquartile 25% (IQ1) | 12.9% | 13.7% |
| Interquartile 75% (IQ3) | 17.8% | 17.7% |
| Interquartile Range (IQR) | 4.9% | 4.0% |
| Standard Deviation (Sample) | 4.3% | 5.4% |
| Standard Deviation (Population) | 4.3% | 5.3% |
Demographics Similar to Immigrants from Indonesia and Immigrants from Turkey by Cognitive Disability
In terms of cognitive disability, the demographic groups most similar to Immigrants from Indonesia are Immigrants from Kazakhstan (17.1%, a difference of 0.10%), Immigrants from Malaysia (17.1%, a difference of 0.16%), Brazilian (17.1%, a difference of 0.17%), Sri Lankan (17.1%, a difference of 0.18%), and Immigrants from Australia (17.1%, a difference of 0.30%). Similarly, the demographic groups most similar to Immigrants from Turkey are Tlingit-Haida (17.2%, a difference of 0.080%), Ecuadorian (17.2%, a difference of 0.090%), Immigrants from Portugal (17.2%, a difference of 0.15%), Immigrants (17.2%, a difference of 0.17%), and Immigrants from Syria (17.2%, a difference of 0.20%).
| Demographics | Rating | Rank | Cognitive Disability |
| Immigrants | Indonesia | 82.7 /100 | #152 | Excellent 17.1% |
| Immigrants | Kazakhstan | 80.5 /100 | #153 | Excellent 17.1% |
| Immigrants | Malaysia | 79.3 /100 | #154 | Good 17.1% |
| Brazilians | 78.9 /100 | #155 | Good 17.1% |
| Sri Lankans | 78.9 /100 | #156 | Good 17.1% |
| Immigrants | Australia | 76.0 /100 | #157 | Good 17.1% |
| Celtics | 74.1 /100 | #158 | Good 17.1% |
| Immigrants | Latvia | 73.2 /100 | #159 | Good 17.2% |
| Australians | 72.4 /100 | #160 | Good 17.2% |
| Americans | 72.2 /100 | #161 | Good 17.2% |
| Yugoslavians | 71.6 /100 | #162 | Good 17.2% |
| Immigrants | Switzerland | 71.5 /100 | #163 | Good 17.2% |
| Armenians | 70.1 /100 | #164 | Good 17.2% |
| Immigrants | Albania | 64.9 /100 | #165 | Good 17.2% |
| Immigrants | Ecuador | 64.4 /100 | #166 | Good 17.2% |
| Immigrants | Syria | 63.5 /100 | #167 | Good 17.2% |
| Immigrants | Immigrants | 62.5 /100 | #168 | Good 17.2% |
| Immigrants | Portugal | 61.8 /100 | #169 | Good 17.2% |
| Ecuadorians | 59.6 /100 | #170 | Average 17.2% |
| Tlingit-Haida | 59.4 /100 | #171 | Average 17.2% |
| Immigrants | Turkey | 56.7 /100 | #172 | Average 17.2% |