Paiute vs Immigrants from Turkey Cognitive Disability
COMPARE
Paiute
Immigrants from Turkey
Cognitive Disability
Cognitive Disability Comparison
Paiute
Immigrants from Turkey
17.8%
COGNITIVE DISABILITY
1.1/ 100
METRIC RATING
242nd/ 347
METRIC RANK
17.2%
COGNITIVE DISABILITY
56.7/ 100
METRIC RATING
172nd/ 347
METRIC RANK
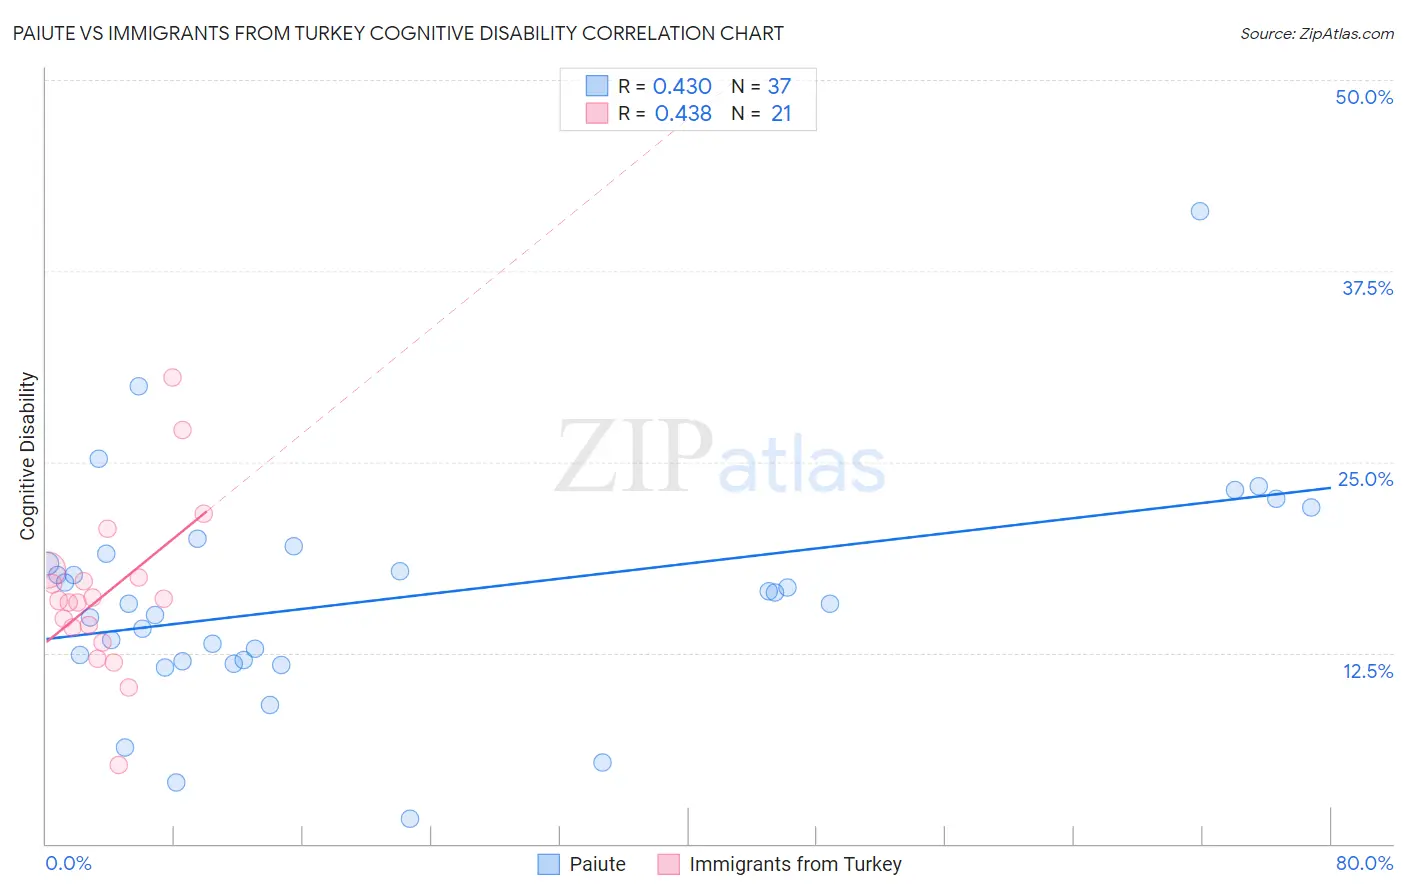
Paiute vs Immigrants from Turkey Cognitive Disability Correlation Chart
The statistical analysis conducted on geographies consisting of 58,394,773 people shows a moderate positive correlation between the proportion of Paiute and percentage of population with cognitive disability in the United States with a correlation coefficient (R) of 0.430 and weighted average of 17.8%. Similarly, the statistical analysis conducted on geographies consisting of 223,051,603 people shows a moderate positive correlation between the proportion of Immigrants from Turkey and percentage of population with cognitive disability in the United States with a correlation coefficient (R) of 0.438 and weighted average of 17.2%, a difference of 3.4%.
Cognitive Disability Correlation Summary
| Measurement | Paiute | Immigrants from Turkey |
| Minimum | 1.6% | 5.2% |
| Maximum | 41.4% | 30.5% |
| Range | 39.8% | 25.3% |
| Mean | 16.1% | 16.4% |
| Median | 15.8% | 15.9% |
| Interquartile 25% (IQ1) | 12.0% | 13.7% |
| Interquartile 75% (IQ3) | 19.2% | 17.7% |
| Interquartile Range (IQR) | 7.2% | 4.0% |
| Standard Deviation (Sample) | 7.3% | 5.4% |
| Standard Deviation (Population) | 7.2% | 5.3% |
Similar Demographics by Cognitive Disability
Demographics Similar to Paiute by Cognitive Disability
In terms of cognitive disability, the demographic groups most similar to Paiute are Mexican (17.8%, a difference of 0.020%), Immigrants from Bangladesh (17.8%, a difference of 0.070%), Jamaican (17.9%, a difference of 0.11%), Iraqi (17.8%, a difference of 0.16%), and Cajun (17.8%, a difference of 0.19%).
| Demographics | Rating | Rank | Cognitive Disability |
| Spanish American Indians | 2.0 /100 | #235 | Tragic 17.8% |
| Immigrants | Iraq | 1.8 /100 | #236 | Tragic 17.8% |
| Immigrants | Mexico | 1.8 /100 | #237 | Tragic 17.8% |
| Cheyenne | 1.7 /100 | #238 | Tragic 17.8% |
| Cajuns | 1.4 /100 | #239 | Tragic 17.8% |
| Iraqis | 1.4 /100 | #240 | Tragic 17.8% |
| Mexicans | 1.1 /100 | #241 | Tragic 17.8% |
| Paiute | 1.1 /100 | #242 | Tragic 17.8% |
| Immigrants | Bangladesh | 1.0 /100 | #243 | Tragic 17.8% |
| Jamaicans | 0.9 /100 | #244 | Tragic 17.9% |
| Trinidadians and Tobagonians | 0.8 /100 | #245 | Tragic 17.9% |
| Immigrants | Thailand | 0.8 /100 | #246 | Tragic 17.9% |
| Samoans | 0.7 /100 | #247 | Tragic 17.9% |
| French American Indians | 0.7 /100 | #248 | Tragic 17.9% |
| Cree | 0.7 /100 | #249 | Tragic 17.9% |
Demographics Similar to Immigrants from Turkey by Cognitive Disability
In terms of cognitive disability, the demographic groups most similar to Immigrants from Turkey are Tlingit-Haida (17.2%, a difference of 0.080%), Ecuadorian (17.2%, a difference of 0.090%), Immigrants from Portugal (17.2%, a difference of 0.15%), Immigrants (17.2%, a difference of 0.17%), and Immigrants from Northern Africa (17.3%, a difference of 0.18%).
| Demographics | Rating | Rank | Cognitive Disability |
| Immigrants | Albania | 64.9 /100 | #165 | Good 17.2% |
| Immigrants | Ecuador | 64.4 /100 | #166 | Good 17.2% |
| Immigrants | Syria | 63.5 /100 | #167 | Good 17.2% |
| Immigrants | Immigrants | 62.5 /100 | #168 | Good 17.2% |
| Immigrants | Portugal | 61.8 /100 | #169 | Good 17.2% |
| Ecuadorians | 59.6 /100 | #170 | Average 17.2% |
| Tlingit-Haida | 59.4 /100 | #171 | Average 17.2% |
| Immigrants | Turkey | 56.7 /100 | #172 | Average 17.2% |
| Immigrants | Northern Africa | 50.2 /100 | #173 | Average 17.3% |
| Laotians | 50.0 /100 | #174 | Average 17.3% |
| Tsimshian | 49.8 /100 | #175 | Average 17.3% |
| Shoshone | 49.2 /100 | #176 | Average 17.3% |
| Ute | 49.1 /100 | #177 | Average 17.3% |
| Spanish | 48.9 /100 | #178 | Average 17.3% |
| Sioux | 48.6 /100 | #179 | Average 17.3% |