Immigrants from Panama vs Immigrants from Honduras Cognitive Disability

COMPARE

Immigrants from Panama
Race
Ancestry
AfghanAfricanAlaska NativeAlaskan AthabascanAlbanianAleutAlsatianAmericanApacheArabArapahoArgentineanArmenianAssyrian/Chaldean/SyriacAustralianAustrianBahamianBangladeshiBarbadianBasqueBelgianBelizeanBermudanBhutaneseBlackfeetBolivianBrazilianBritishBritish West IndianBulgarianBurmeseCajunCambodianCanadianCape VerdeanCarpatho RusynCelticCentral AmericanCentral American IndianCherokeeCheyenneChickasawChileanChineseChippewaChoctawColombianColvilleComancheCosta RicanCreeCreekCroatianCrowCubanCypriotCzechCzechoslovakianDanishDelawareDominicanDutchDutch West IndianEastern EuropeanEcuadorianEgyptianEnglishEstonianEthiopianEuropeanFijianFilipinoFinnishFrenchFrench American IndianFrench CanadianGermanGerman RussianGhanaianGreekGuamanian/ChamorroGuatemalanGuyaneseHaitianHmongHonduranHopiHoumaHungarianIcelanderIndian (Asian)IndonesianInupiatIranianIraqiIrishIroquoisIsraeliItalianJamaicanJapaneseJordanianKenyanKiowaKoreanLaotianLatvianLebaneseLiberianLithuanianLumbeeLuxembourgerMacedonianMalaysianMalteseMarshalleseMenomineeMexicanMexican American IndianMongolianMoroccanNative HawaiianNavajoNepaleseNew ZealanderNicaraguanNigerianNorthern EuropeanNorwegianOkinawanOsageOttawaPaiutePakistaniPalestinianPanamanianParaguayanPennsylvania GermanPeruvianPimaPolishPortuguesePotawatomiPuebloPuerto RicanPuget Sound SalishRomanianRussianSalvadoranSamoanScandinavianScotch-IrishScottishSeminoleSenegaleseSerbianShoshoneSierra LeoneanSiouxSlavicSlovakSloveneSomaliSouth AfricanSouth AmericanSouth American IndianSoviet UnionSpaniardSpanishSpanish AmericanSpanish American IndianSri LankanSubsaharan AfricanSudaneseSwedishSwissSyrianTaiwaneseThaiTlingit-HaidaTohono O'OdhamTonganTrinidadian and TobagonianTsimshianTurkishU.S. Virgin IslanderUgandanUkrainianUruguayanUteVenezuelanVietnameseWelshWest IndianYakamaYaquiYugoslavianYumanYup'ikZimbabwean
Immigration
NonimmigrantsImmigrantsAfghanistanAfricaAlbaniaArgentinaArmeniaAsiaAustraliaAustriaBahamasBangladeshBarbadosBelarusBelgiumBelizeBoliviaBosnia and HerzegovinaBrazilBulgariaBurma/MyanmarCabo VerdeCambodiaCameroonCanadaCaribbeanCentral AmericaChileChinaColombiaCongoCosta RicaCroatiaCubaCzechoslovakiaDenmarkDominicaDominican RepublicEastern AfricaEastern AsiaEastern EuropeEcuadorEgyptEl SalvadorEnglandEritreaEthiopiaEuropeFijiFranceGermanyGhanaGreeceGrenadaGuatemalaGuyanaHaitiHong KongHungaryIndiaIndonesiaIranIraqIrelandIsraelItalyJamaicaJapanJordanKazakhstanKenyaKoreaKuwaitLaosLatin AmericaLatviaLebanonLiberiaLithuaniaMalaysiaMexicoMicronesiaMiddle AfricaMoldovaMoroccoNepalNetherlandsNicaraguaNigeriaNorth AmericaNorth MacedoniaNorthern AfricaNorthern EuropeNorwayOceaniaPakistanPanamaPeruPhilippinesPolandPortugalRomaniaRussiaSaudi ArabiaScotlandSenegalSerbiaSierra LeoneSingaporeSomaliaSouth AfricaSouth AmericaSouth Central AsiaSouth Eastern AsiaSouthern EuropeSpainSri LankaSt. Vincent and the GrenadinesSudanSwedenSwitzerlandSyriaTaiwanThailandTrinidad and TobagoTurkeyUgandaUkraineUruguayUzbekistanVenezuelaVietnamWest IndiesWestern AfricaWestern AsiaWestern EuropeYemenZaireZimbabweAzores
Immigrants from Honduras
Race
Ancestry
AfghanAfricanAlaska NativeAlaskan AthabascanAlbanianAleutAlsatianAmericanApacheArabArapahoArgentineanArmenianAssyrian/Chaldean/SyriacAustralianAustrianBahamianBangladeshiBarbadianBasqueBelgianBelizeanBermudanBhutaneseBlackfeetBolivianBrazilianBritishBritish West IndianBulgarianBurmeseCajunCambodianCanadianCape VerdeanCarpatho RusynCelticCentral AmericanCentral American IndianCherokeeCheyenneChickasawChileanChineseChippewaChoctawColombianColvilleComancheCosta RicanCreeCreekCroatianCrowCubanCypriotCzechCzechoslovakianDanishDelawareDominicanDutchDutch West IndianEastern EuropeanEcuadorianEgyptianEnglishEstonianEthiopianEuropeanFijianFilipinoFinnishFrenchFrench American IndianFrench CanadianGermanGerman RussianGhanaianGreekGuamanian/ChamorroGuatemalanGuyaneseHaitianHmongHonduranHopiHoumaHungarianIcelanderIndian (Asian)IndonesianInupiatIranianIraqiIrishIroquoisIsraeliItalianJamaicanJapaneseJordanianKenyanKiowaKoreanLaotianLatvianLebaneseLiberianLithuanianLumbeeLuxembourgerMacedonianMalaysianMalteseMarshalleseMenomineeMexicanMexican American IndianMongolianMoroccanNative HawaiianNavajoNepaleseNew ZealanderNicaraguanNigerianNorthern EuropeanNorwegianOkinawanOsageOttawaPaiutePakistaniPalestinianPanamanianParaguayanPennsylvania GermanPeruvianPimaPolishPortuguesePotawatomiPuebloPuerto RicanPuget Sound SalishRomanianRussianSalvadoranSamoanScandinavianScotch-IrishScottishSeminoleSenegaleseSerbianShoshoneSierra LeoneanSiouxSlavicSlovakSloveneSomaliSouth AfricanSouth AmericanSouth American IndianSoviet UnionSpaniardSpanishSpanish AmericanSpanish American IndianSri LankanSubsaharan AfricanSudaneseSwedishSwissSyrianTaiwaneseThaiTlingit-HaidaTohono O'OdhamTonganTrinidadian and TobagonianTsimshianTurkishU.S. Virgin IslanderUgandanUkrainianUruguayanUteVenezuelanVietnameseWelshWest IndianYakamaYaquiYugoslavianYumanYup'ikZimbabwean
Immigration
NonimmigrantsImmigrantsAfghanistanAfricaAlbaniaArgentinaArmeniaAsiaAustraliaAustriaBahamasBangladeshBarbadosBelarusBelgiumBelizeBoliviaBosnia and HerzegovinaBrazilBulgariaBurma/MyanmarCabo VerdeCambodiaCameroonCanadaCaribbeanCentral AmericaChileChinaColombiaCongoCosta RicaCroatiaCubaCzechoslovakiaDenmarkDominicaDominican RepublicEastern AfricaEastern AsiaEastern EuropeEcuadorEgyptEl SalvadorEnglandEritreaEthiopiaEuropeFijiFranceGermanyGhanaGreeceGrenadaGuatemalaGuyanaHaitiHondurasHong KongHungaryIndiaIndonesiaIranIraqIrelandIsraelItalyJamaicaJapanJordanKazakhstanKenyaKoreaKuwaitLaosLatin AmericaLatviaLebanonLiberiaLithuaniaMalaysiaMexicoMicronesiaMiddle AfricaMoldovaMoroccoNepalNetherlandsNicaraguaNigeriaNorth AmericaNorth MacedoniaNorthern AfricaNorthern EuropeNorwayOceaniaPakistanPeruPhilippinesPolandPortugalRomaniaRussiaSaudi ArabiaScotlandSenegalSerbiaSierra LeoneSingaporeSomaliaSouth AfricaSouth AmericaSouth Central AsiaSouth Eastern AsiaSouthern EuropeSpainSri LankaSt. Vincent and the GrenadinesSudanSwedenSwitzerlandSyriaTaiwanThailandTrinidad and TobagoTurkeyUgandaUkraineUruguayUzbekistanVenezuelaVietnamWest IndiesWestern AfricaWestern AsiaWestern EuropeYemenZaireZimbabweAzores
Cognitive Disability
Income
Poverty
Unemployment
Labor Participation
Family Structure
Vehicle Availability
Education Level
Disability

Cognitive Disability Comparison

Immigrants from Panama

Immigrants from Honduras

Poor
Tragic
17.5%
COGNITIVE DISABILITY
14.8/ 100
METRIC RATING
198th/ 347
METRIC RANK
18.0%
COGNITIVE DISABILITY
0.2/ 100
METRIC RATING
272nd/ 347
METRIC RANK

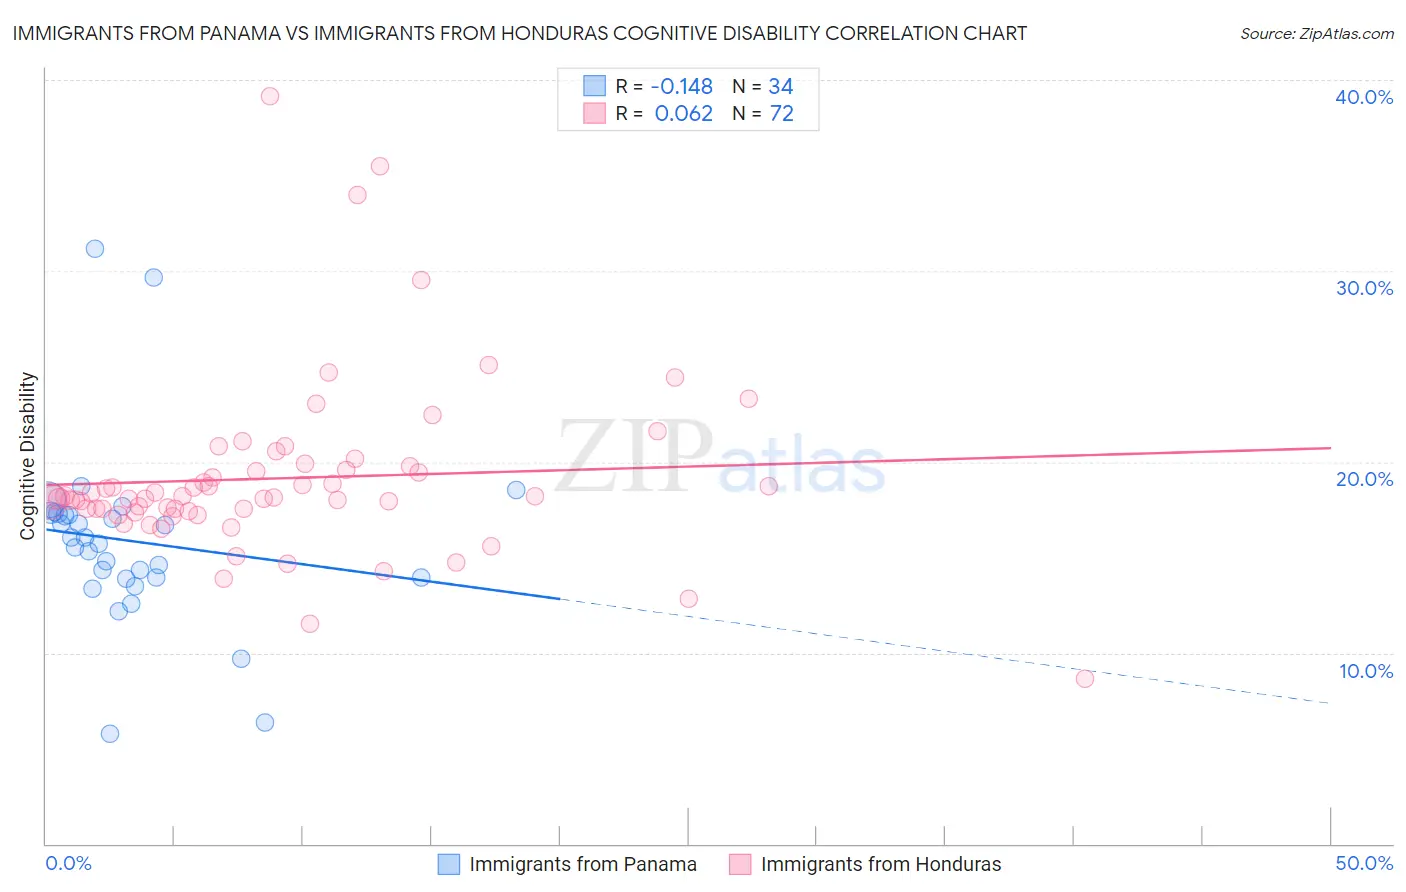
Immigrants from Panama vs Immigrants from Honduras Cognitive Disability Correlation Chart

The statistical analysis conducted on geographies consisting of 221,178,303 people shows a poor negative correlation between the proportion of Immigrants from Panama and percentage of population with cognitive disability in the United States with a correlation coefficient (R) of -0.148 and weighted average of 17.5%. Similarly, the statistical analysis conducted on geographies consisting of 322,550,797 people shows a slight positive correlation between the proportion of Immigrants from Honduras and percentage of population with cognitive disability in the United States with a correlation coefficient (R) of 0.062 and weighted average of 18.0%, a difference of 3.0%.
Immigrants from Panama vs Immigrants from Honduras Cognitive Disability

Cognitive Disability Correlation Summary

MeasurementImmigrants from PanamaImmigrants from Honduras
Minimum5.8%8.7%
Maximum31.2%39.1%
Range25.4%30.5%
Mean15.9%19.1%
Median15.9%18.1%
Interquartile 25% (IQ1)13.9%17.5%
Interquartile 75% (IQ3)17.3%19.7%
Interquartile Range (IQR)3.3%2.2%
Standard Deviation (Sample)4.8%4.7%
Standard Deviation (Population)4.7%4.7%

Similar Demographics by Cognitive Disability

Demographics Similar to Immigrants from Panama by Cognitive Disability

In terms of cognitive disability, the demographic groups most similar to Immigrants from Panama are Immigrants from Singapore (17.5%, a difference of 0.030%), Haitian (17.5%, a difference of 0.040%), Immigrants from Afghanistan (17.5%, a difference of 0.10%), South American Indian (17.5%, a difference of 0.11%), and Guyanese (17.5%, a difference of 0.14%).
DemographicsRating | RankCognitive Disability
Immigrants | Nonimmigrants
27.4
/100
|
#191
Fair
17.4%
Immigrants | Haiti
27.1
/100
|
#192
Fair
17.4%
Delaware
25.6
/100
|
#193
Fair
17.4%
Immigrants | Bosnia and Herzegovina
22.0
/100
|
#194
Fair
17.4%
New Zealanders
21.1
/100
|
#195
Fair
17.4%
Guyanese
17.5
/100
|
#196
Poor
17.5%
Immigrants | Afghanistan
16.7
/100
|
#197
Poor
17.5%
Immigrants | Panama
14.8
/100
|
#198
Poor
17.5%
Immigrants | Singapore
14.3
/100
|
#199
Poor
17.5%
Haitians
14.1
/100
|
#200
Poor
17.5%
South American Indians
13.0
/100
|
#201
Poor
17.5%
Immigrants | Morocco
12.0
/100
|
#202
Poor
17.5%
Immigrants | Caribbean
11.0
/100
|
#203
Poor
17.5%
Immigrants | Zimbabwe
11.0
/100
|
#204
Poor
17.5%
Puget Sound Salish
10.9
/100
|
#205
Poor
17.5%

Demographics Similar to Immigrants from Honduras by Cognitive Disability

In terms of cognitive disability, the demographic groups most similar to Immigrants from Honduras are Potawatomi (18.0%, a difference of 0.010%), Immigrants from Bahamas (18.0%, a difference of 0.090%), Honduran (18.0%, a difference of 0.10%), Immigrants from Nepal (18.0%, a difference of 0.12%), and Immigrants from Nigeria (18.0%, a difference of 0.13%).
DemographicsRating | RankCognitive Disability
Spanish Americans
0.4
/100
|
#265
Tragic
18.0%
Belizeans
0.4
/100
|
#266
Tragic
18.0%
Nepalese
0.3
/100
|
#267
Tragic
18.0%
Cherokee
0.3
/100
|
#268
Tragic
18.0%
Hondurans
0.3
/100
|
#269
Tragic
18.0%
Immigrants | Bahamas
0.3
/100
|
#270
Tragic
18.0%
Potawatomi
0.2
/100
|
#271
Tragic
18.0%
Immigrants | Honduras
0.2
/100
|
#272
Tragic
18.0%
Immigrants | Nepal
0.2
/100
|
#273
Tragic
18.0%
Immigrants | Nigeria
0.2
/100
|
#274
Tragic
18.0%
Immigrants | Laos
0.2
/100
|
#275
Tragic
18.1%
Yuman
0.2
/100
|
#276
Tragic
18.1%
Immigrants | Kuwait
0.2
/100
|
#277
Tragic
18.1%
Immigrants | Micronesia
0.2
/100
|
#278
Tragic
18.1%
Chippewa
0.1
/100
|
#279
Tragic
18.1%