Iranian vs Immigrants from Bangladesh Disability
COMPARE
Iranian
Immigrants from Bangladesh
Disability
Disability Comparison
Iranians
Immigrants from Bangladesh
10.1%
DISABILITY
100.0/ 100
METRIC RATING
11th/ 347
METRIC RANK
11.0%
DISABILITY
99.4/ 100
METRIC RATING
73rd/ 347
METRIC RANK
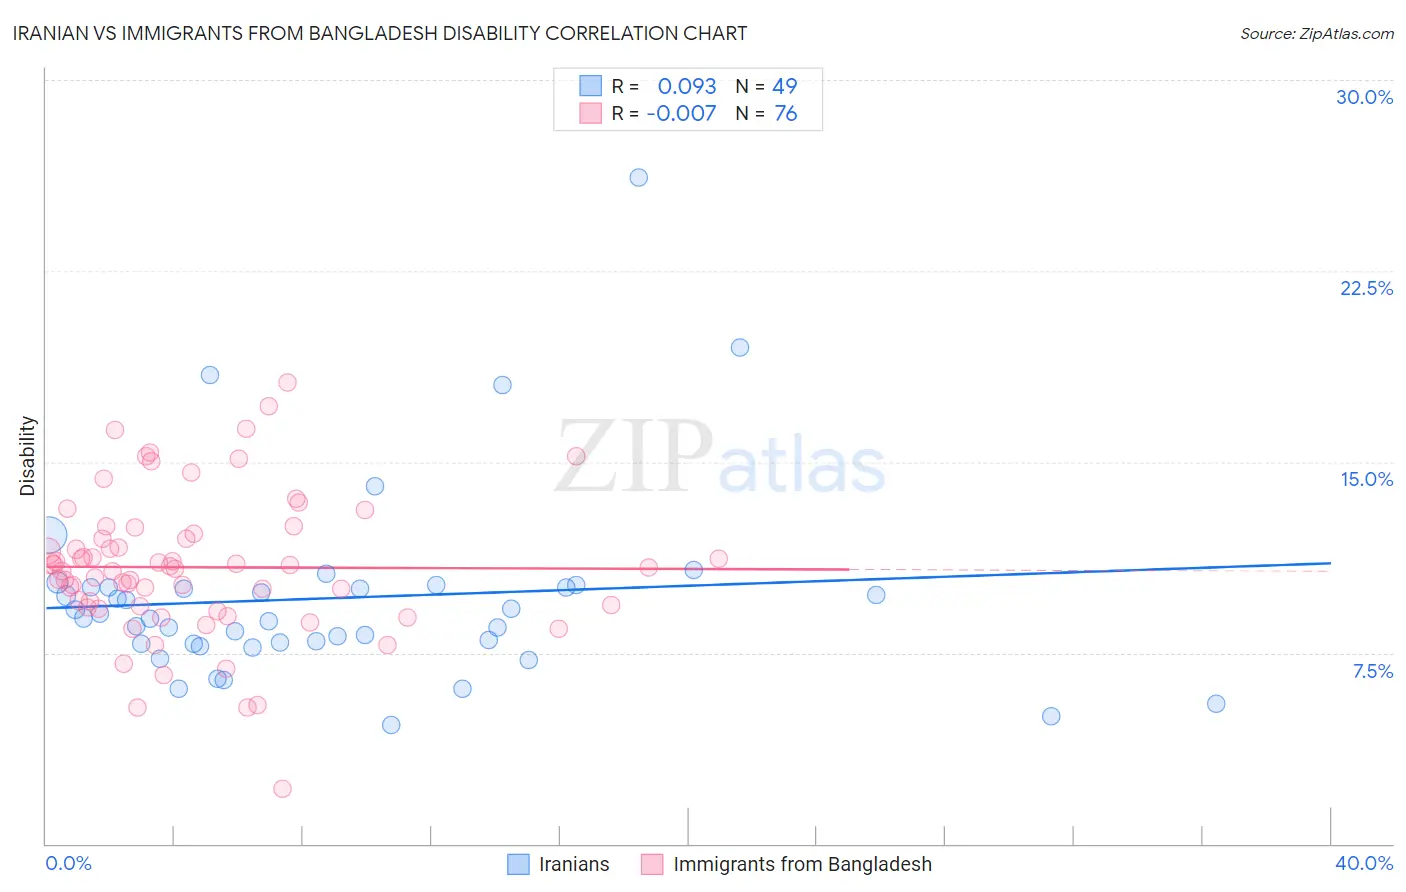
Iranian vs Immigrants from Bangladesh Disability Correlation Chart
The statistical analysis conducted on geographies consisting of 316,882,052 people shows a slight positive correlation between the proportion of Iranians and percentage of population with a disability in the United States with a correlation coefficient (R) of 0.093 and weighted average of 10.1%. Similarly, the statistical analysis conducted on geographies consisting of 203,681,274 people shows no correlation between the proportion of Immigrants from Bangladesh and percentage of population with a disability in the United States with a correlation coefficient (R) of -0.007 and weighted average of 11.0%, a difference of 9.2%.
Disability Correlation Summary
| Measurement | Iranian | Immigrants from Bangladesh |
| Minimum | 4.6% | 2.2% |
| Maximum | 26.2% | 18.1% |
| Range | 21.5% | 15.9% |
| Mean | 9.7% | 10.9% |
| Median | 8.9% | 10.8% |
| Interquartile 25% (IQ1) | 7.9% | 9.3% |
| Interquartile 75% (IQ3) | 10.1% | 12.1% |
| Interquartile Range (IQR) | 2.2% | 2.8% |
| Standard Deviation (Sample) | 3.8% | 2.8% |
| Standard Deviation (Population) | 3.8% | 2.8% |
Similar Demographics by Disability
Demographics Similar to Iranians by Disability
In terms of disability, the demographic groups most similar to Iranians are Immigrants from China (10.1%, a difference of 0.010%), Immigrants from Israel (10.1%, a difference of 0.25%), Immigrants from Eastern Asia (10.2%, a difference of 0.46%), Immigrants from Hong Kong (10.0%, a difference of 0.82%), and Immigrants from Korea (10.2%, a difference of 1.1%).
| Demographics | Rating | Rank | Disability |
| Thais | 100.0 /100 | #4 | Exceptional 9.7% |
| Immigrants | Bolivia | 100.0 /100 | #5 | Exceptional 9.9% |
| Immigrants | South Central Asia | 100.0 /100 | #6 | Exceptional 9.9% |
| Immigrants | Singapore | 100.0 /100 | #7 | Exceptional 10.0% |
| Bolivians | 100.0 /100 | #8 | Exceptional 10.0% |
| Immigrants | Hong Kong | 100.0 /100 | #9 | Exceptional 10.0% |
| Immigrants | China | 100.0 /100 | #10 | Exceptional 10.1% |
| Iranians | 100.0 /100 | #11 | Exceptional 10.1% |
| Immigrants | Israel | 100.0 /100 | #12 | Exceptional 10.1% |
| Immigrants | Eastern Asia | 100.0 /100 | #13 | Exceptional 10.2% |
| Immigrants | Korea | 100.0 /100 | #14 | Exceptional 10.2% |
| Okinawans | 100.0 /100 | #15 | Exceptional 10.3% |
| Indians (Asian) | 100.0 /100 | #16 | Exceptional 10.3% |
| Immigrants | Iran | 100.0 /100 | #17 | Exceptional 10.3% |
| Burmese | 100.0 /100 | #18 | Exceptional 10.4% |
Demographics Similar to Immigrants from Bangladesh by Disability
In terms of disability, the demographic groups most similar to Immigrants from Bangladesh are Immigrants from Serbia (11.0%, a difference of 0.020%), Immigrants from Chile (11.0%, a difference of 0.030%), Immigrants from Vietnam (11.0%, a difference of 0.040%), Sierra Leonean (11.0%, a difference of 0.070%), and Immigrants from Belgium (11.0%, a difference of 0.070%).
| Demographics | Rating | Rank | Disability |
| Laotians | 99.6 /100 | #66 | Exceptional 11.0% |
| Colombians | 99.6 /100 | #67 | Exceptional 11.0% |
| Immigrants | Afghanistan | 99.6 /100 | #68 | Exceptional 11.0% |
| Sri Lankans | 99.5 /100 | #69 | Exceptional 11.0% |
| Immigrants | France | 99.4 /100 | #70 | Exceptional 11.0% |
| Immigrants | Lebanon | 99.4 /100 | #71 | Exceptional 11.0% |
| Immigrants | Chile | 99.4 /100 | #72 | Exceptional 11.0% |
| Immigrants | Bangladesh | 99.4 /100 | #73 | Exceptional 11.0% |
| Immigrants | Serbia | 99.4 /100 | #74 | Exceptional 11.0% |
| Immigrants | Vietnam | 99.4 /100 | #75 | Exceptional 11.0% |
| Sierra Leoneans | 99.3 /100 | #76 | Exceptional 11.0% |
| Immigrants | Belgium | 99.3 /100 | #77 | Exceptional 11.0% |
| Immigrants | Cameroon | 99.3 /100 | #78 | Exceptional 11.1% |
| Immigrants | Jordan | 99.3 /100 | #79 | Exceptional 11.1% |
| Immigrants | Ireland | 99.3 /100 | #80 | Exceptional 11.1% |