Inupiat vs Turkish Single Father Households
COMPARE
Inupiat
Turkish
Single Father Households
Single Father Households Comparison
Inupiat
Turks
4.9%
SINGLE FATHER HOUSEHOLDS
0.0/ 100
METRIC RATING
346th/ 347
METRIC RANK
2.0%
SINGLE FATHER HOUSEHOLDS
100.0/ 100
METRIC RATING
33rd/ 347
METRIC RANK
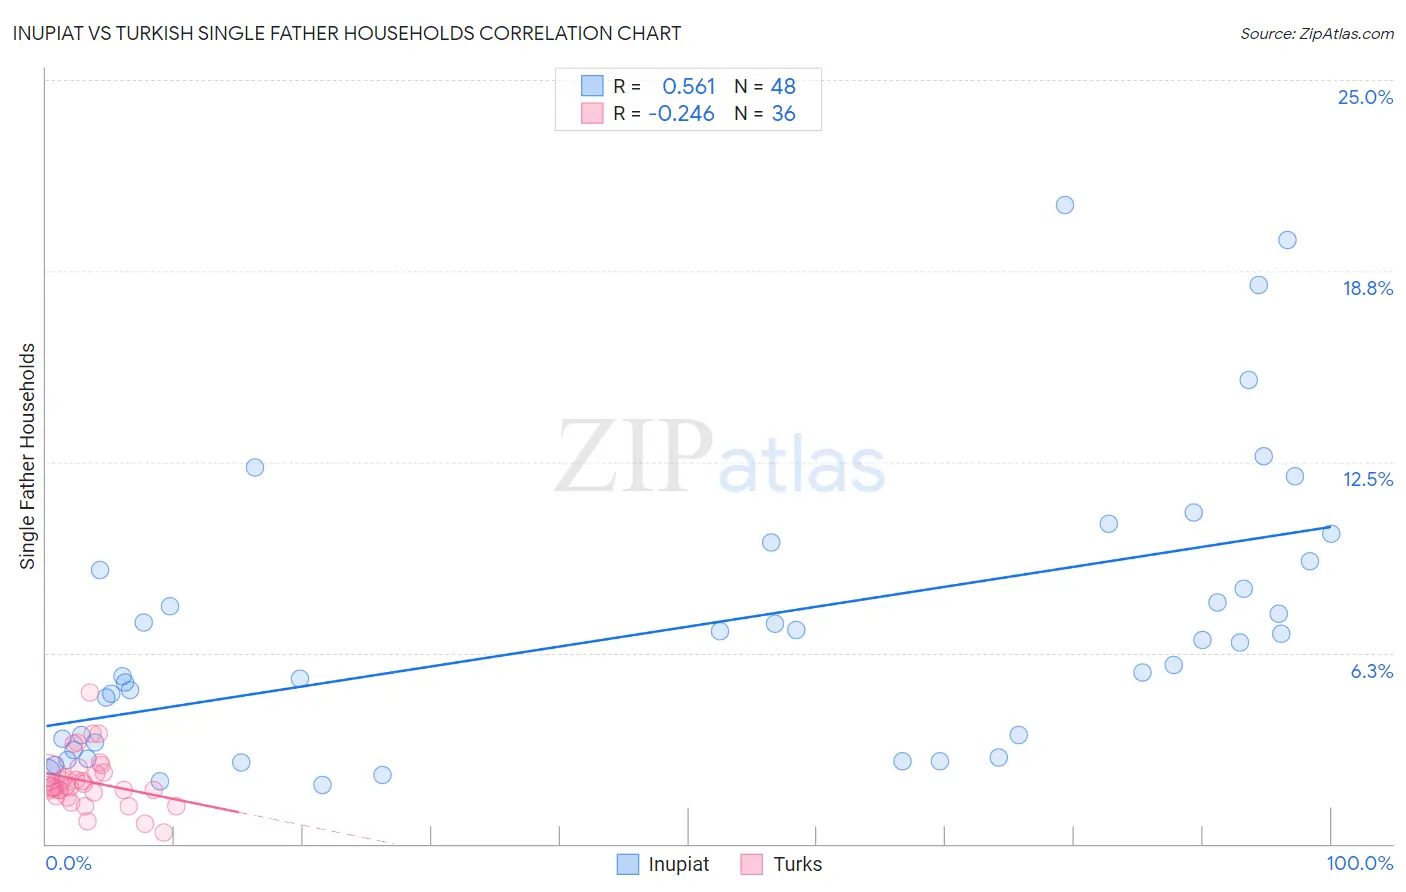
Inupiat vs Turkish Single Father Households Correlation Chart
The statistical analysis conducted on geographies consisting of 96,117,395 people shows a substantial positive correlation between the proportion of Inupiat and percentage of single father households in the United States with a correlation coefficient (R) of 0.561 and weighted average of 4.9%. Similarly, the statistical analysis conducted on geographies consisting of 270,298,276 people shows a weak negative correlation between the proportion of Turks and percentage of single father households in the United States with a correlation coefficient (R) of -0.246 and weighted average of 2.0%, a difference of 146.0%.
Single Father Households Correlation Summary
| Measurement | Inupiat | Turkish |
| Minimum | 1.9% | 0.37% |
| Maximum | 20.9% | 5.0% |
| Range | 19.0% | 4.6% |
| Mean | 7.0% | 2.0% |
| Median | 6.2% | 1.9% |
| Interquartile 25% (IQ1) | 3.2% | 1.6% |
| Interquartile 75% (IQ3) | 9.1% | 2.3% |
| Interquartile Range (IQR) | 5.9% | 0.70% |
| Standard Deviation (Sample) | 4.6% | 0.89% |
| Standard Deviation (Population) | 4.6% | 0.88% |
Similar Demographics by Single Father Households
Demographics Similar to Inupiat by Single Father Households
In terms of single father households, the demographic groups most similar to Inupiat are Yup'ik (5.4%, a difference of 10.7%), Menominee (4.2%, a difference of 15.3%), Yakama (4.2%, a difference of 16.2%), Pima (4.2%, a difference of 16.4%), and Tohono O'odham (3.8%, a difference of 27.2%).
| Demographics | Rating | Rank | Single Father Households |
| Natives/Alaskans | 0.0 /100 | #333 | Tragic 3.2% |
| Yuman | 0.0 /100 | #334 | Tragic 3.3% |
| Colville | 0.0 /100 | #335 | Tragic 3.3% |
| Paiute | 0.0 /100 | #336 | Tragic 3.3% |
| Pueblo | 0.0 /100 | #337 | Tragic 3.3% |
| Sioux | 0.0 /100 | #338 | Tragic 3.3% |
| Alaskan Athabascans | 0.0 /100 | #339 | Tragic 3.4% |
| Alaska Natives | 0.0 /100 | #340 | Tragic 3.5% |
| Crow | 0.0 /100 | #341 | Tragic 3.5% |
| Tohono O'odham | 0.0 /100 | #342 | Tragic 3.8% |
| Pima | 0.0 /100 | #343 | Tragic 4.2% |
| Yakama | 0.0 /100 | #344 | Tragic 4.2% |
| Menominee | 0.0 /100 | #345 | Tragic 4.2% |
| Inupiat | 0.0 /100 | #346 | Tragic 4.9% |
| Yup'ik | 0.0 /100 | #347 | Tragic 5.4% |
Demographics Similar to Turks by Single Father Households
In terms of single father households, the demographic groups most similar to Turks are Immigrants from Australia (2.0%, a difference of 0.020%), Chinese (2.0%, a difference of 0.21%), Israeli (2.0%, a difference of 0.25%), Cambodian (2.0%, a difference of 0.28%), and Bulgarian (2.0%, a difference of 0.31%).
| Demographics | Rating | Rank | Single Father Households |
| Assyrians/Chaldeans/Syriacs | 100.0 /100 | #26 | Exceptional 2.0% |
| Immigrants | South Central Asia | 100.0 /100 | #27 | Exceptional 2.0% |
| Immigrants | Japan | 100.0 /100 | #28 | Exceptional 2.0% |
| Bulgarians | 100.0 /100 | #29 | Exceptional 2.0% |
| Cambodians | 100.0 /100 | #30 | Exceptional 2.0% |
| Israelis | 100.0 /100 | #31 | Exceptional 2.0% |
| Chinese | 100.0 /100 | #32 | Exceptional 2.0% |
| Turks | 100.0 /100 | #33 | Exceptional 2.0% |
| Immigrants | Australia | 100.0 /100 | #34 | Exceptional 2.0% |
| Albanians | 100.0 /100 | #35 | Exceptional 2.0% |
| Immigrants | Belgium | 100.0 /100 | #36 | Exceptional 2.0% |
| Immigrants | St. Vincent and the Grenadines | 100.0 /100 | #37 | Exceptional 2.0% |
| Immigrants | Eastern Europe | 100.0 /100 | #38 | Exceptional 2.0% |
| Immigrants | Sri Lanka | 100.0 /100 | #39 | Exceptional 2.0% |
| Immigrants | Bulgaria | 100.0 /100 | #40 | Exceptional 2.0% |