Inupiat vs Immigrants from Bosnia and Herzegovina Ambulatory Disability
COMPARE
Inupiat
Immigrants from Bosnia and Herzegovina
Ambulatory Disability
Ambulatory Disability Comparison
Inupiat
Immigrants from Bosnia and Herzegovina
5.6%
AMBULATORY DISABILITY
99.8/ 100
METRIC RATING
56th/ 347
METRIC RANK
6.2%
AMBULATORY DISABILITY
37.2/ 100
METRIC RATING
185th/ 347
METRIC RANK
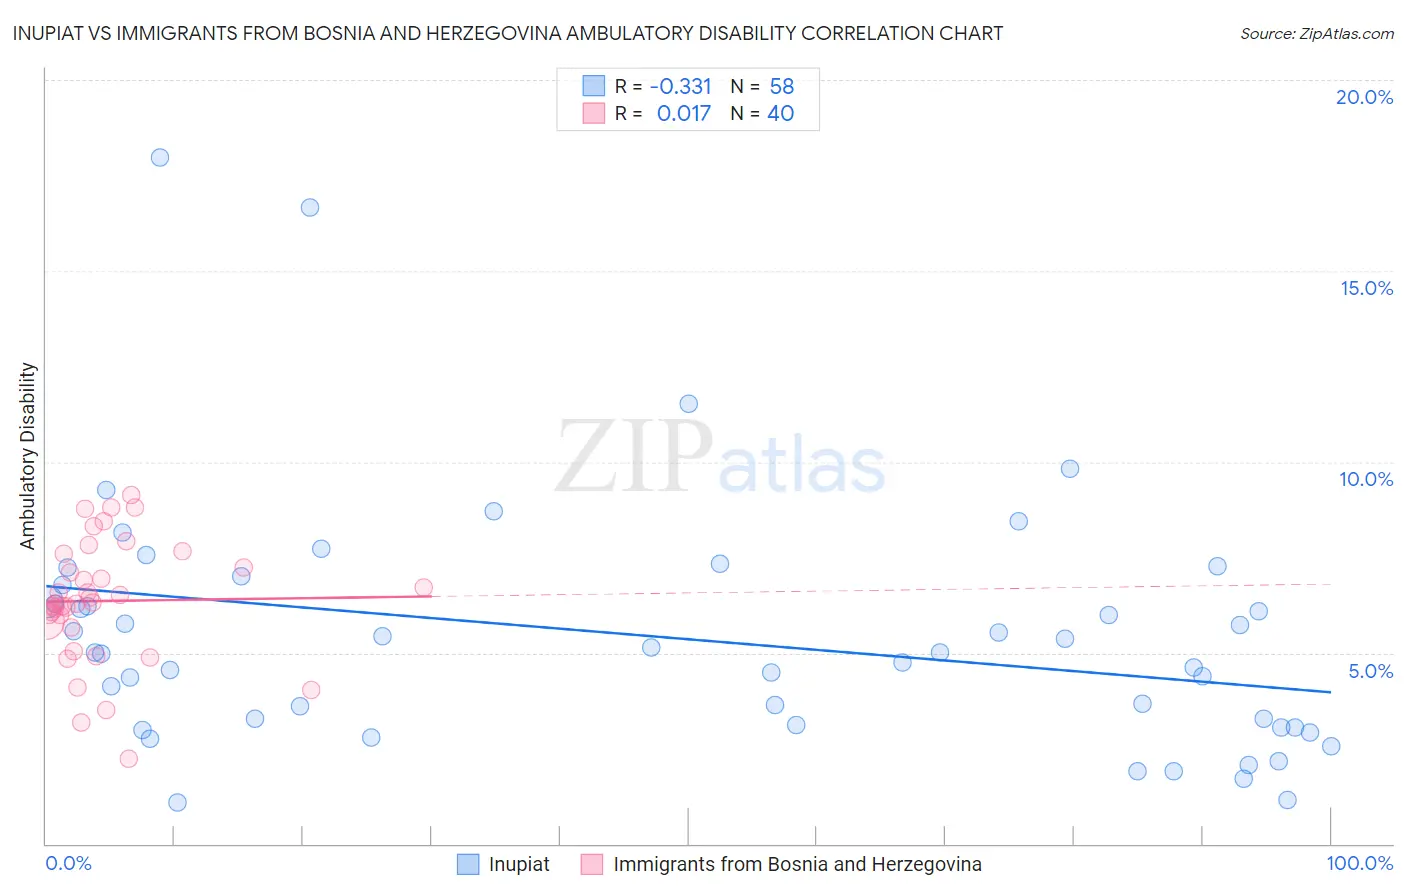
Inupiat vs Immigrants from Bosnia and Herzegovina Ambulatory Disability Correlation Chart
The statistical analysis conducted on geographies consisting of 96,327,130 people shows a mild negative correlation between the proportion of Inupiat and percentage of population with ambulatory disability in the United States with a correlation coefficient (R) of -0.331 and weighted average of 5.6%. Similarly, the statistical analysis conducted on geographies consisting of 156,818,181 people shows no correlation between the proportion of Immigrants from Bosnia and Herzegovina and percentage of population with ambulatory disability in the United States with a correlation coefficient (R) of 0.017 and weighted average of 6.2%, a difference of 9.8%.
Ambulatory Disability Correlation Summary
| Measurement | Inupiat | Immigrants from Bosnia and Herzegovina |
| Minimum | 1.1% | 2.2% |
| Maximum | 18.0% | 9.1% |
| Range | 16.9% | 6.9% |
| Mean | 5.4% | 6.4% |
| Median | 5.0% | 6.3% |
| Interquartile 25% (IQ1) | 3.1% | 5.8% |
| Interquartile 75% (IQ3) | 6.8% | 7.4% |
| Interquartile Range (IQR) | 3.7% | 1.7% |
| Standard Deviation (Sample) | 3.2% | 1.6% |
| Standard Deviation (Population) | 3.2% | 1.6% |
Similar Demographics by Ambulatory Disability
Demographics Similar to Inupiat by Ambulatory Disability
In terms of ambulatory disability, the demographic groups most similar to Inupiat are Immigrants from Bulgaria (5.6%, a difference of 0.090%), Immigrants from Eastern Africa (5.6%, a difference of 0.16%), Immigrants from Egypt (5.6%, a difference of 0.20%), Jordanian (5.6%, a difference of 0.21%), and Immigrants from Brazil (5.6%, a difference of 0.24%).
| Demographics | Rating | Rank | Ambulatory Disability |
| Bulgarians | 99.9 /100 | #49 | Exceptional 5.6% |
| Luxembourgers | 99.9 /100 | #50 | Exceptional 5.6% |
| Taiwanese | 99.8 /100 | #51 | Exceptional 5.6% |
| Jordanians | 99.8 /100 | #52 | Exceptional 5.6% |
| Immigrants | Egypt | 99.8 /100 | #53 | Exceptional 5.6% |
| Immigrants | Eastern Africa | 99.8 /100 | #54 | Exceptional 5.6% |
| Immigrants | Bulgaria | 99.8 /100 | #55 | Exceptional 5.6% |
| Inupiat | 99.8 /100 | #56 | Exceptional 5.6% |
| Immigrants | Brazil | 99.8 /100 | #57 | Exceptional 5.6% |
| Immigrants | Zimbabwe | 99.8 /100 | #58 | Exceptional 5.6% |
| Immigrants | Afghanistan | 99.8 /100 | #59 | Exceptional 5.6% |
| Immigrants | Lithuania | 99.8 /100 | #60 | Exceptional 5.6% |
| Immigrants | Belgium | 99.7 /100 | #61 | Exceptional 5.6% |
| Immigrants | Spain | 99.7 /100 | #62 | Exceptional 5.6% |
| Immigrants | France | 99.7 /100 | #63 | Exceptional 5.6% |
Demographics Similar to Immigrants from Bosnia and Herzegovina by Ambulatory Disability
In terms of ambulatory disability, the demographic groups most similar to Immigrants from Bosnia and Herzegovina are European (6.2%, a difference of 0.060%), Carpatho Rusyn (6.2%, a difference of 0.11%), British (6.2%, a difference of 0.17%), Ukrainian (6.2%, a difference of 0.19%), and Immigrants from Ghana (6.1%, a difference of 0.22%).
| Demographics | Rating | Rank | Ambulatory Disability |
| Scandinavians | 44.5 /100 | #178 | Average 6.1% |
| Austrians | 44.1 /100 | #179 | Average 6.1% |
| Immigrants | Nicaragua | 43.9 /100 | #180 | Average 6.1% |
| Swiss | 43.1 /100 | #181 | Average 6.1% |
| Serbians | 42.8 /100 | #182 | Average 6.1% |
| Immigrants | Thailand | 42.2 /100 | #183 | Average 6.1% |
| Immigrants | Ghana | 41.2 /100 | #184 | Average 6.1% |
| Immigrants | Bosnia and Herzegovina | 37.2 /100 | #185 | Fair 6.2% |
| Europeans | 36.2 /100 | #186 | Fair 6.2% |
| Carpatho Rusyns | 35.3 /100 | #187 | Fair 6.2% |
| British | 34.3 /100 | #188 | Fair 6.2% |
| Ukrainians | 34.0 /100 | #189 | Fair 6.2% |
| Immigrants | Western Africa | 33.4 /100 | #190 | Fair 6.2% |
| Immigrants | Guatemala | 31.9 /100 | #191 | Fair 6.2% |
| Immigrants | Western Europe | 31.6 /100 | #192 | Fair 6.2% |