Inupiat vs Immigrants from Czechoslovakia Female Disability
COMPARE
Inupiat
Immigrants from Czechoslovakia
Female Disability
Female Disability Comparison
Inupiat
Immigrants from Czechoslovakia
11.3%
FEMALE DISABILITY
100.0/ 100
METRIC RATING
50th/ 347
METRIC RANK
11.6%
FEMALE DISABILITY
99.5/ 100
METRIC RATING
92nd/ 347
METRIC RANK
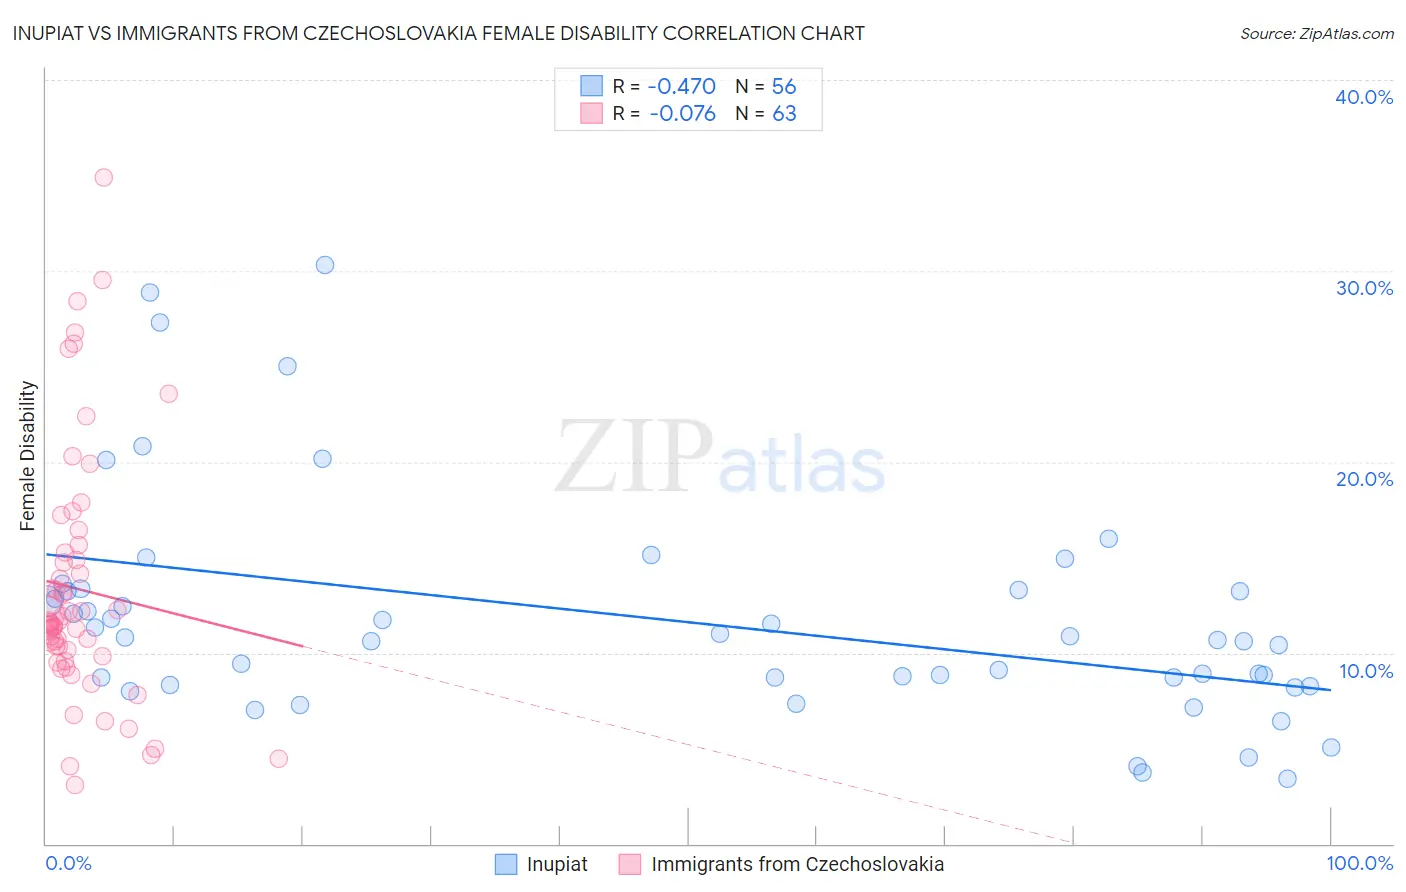
Inupiat vs Immigrants from Czechoslovakia Female Disability Correlation Chart
The statistical analysis conducted on geographies consisting of 96,332,490 people shows a moderate negative correlation between the proportion of Inupiat and percentage of females with a disability in the United States with a correlation coefficient (R) of -0.470 and weighted average of 11.3%. Similarly, the statistical analysis conducted on geographies consisting of 195,453,586 people shows a slight negative correlation between the proportion of Immigrants from Czechoslovakia and percentage of females with a disability in the United States with a correlation coefficient (R) of -0.076 and weighted average of 11.6%, a difference of 2.6%.
Female Disability Correlation Summary
| Measurement | Inupiat | Immigrants from Czechoslovakia |
| Minimum | 3.4% | 3.1% |
| Maximum | 30.3% | 34.9% |
| Range | 26.9% | 31.8% |
| Mean | 11.8% | 13.3% |
| Median | 10.7% | 11.6% |
| Interquartile 25% (IQ1) | 8.5% | 9.8% |
| Interquartile 75% (IQ3) | 13.3% | 15.3% |
| Interquartile Range (IQR) | 4.8% | 5.5% |
| Standard Deviation (Sample) | 5.9% | 6.5% |
| Standard Deviation (Population) | 5.8% | 6.5% |
Similar Demographics by Female Disability
Demographics Similar to Inupiat by Female Disability
In terms of female disability, the demographic groups most similar to Inupiat are Immigrants from Belgium (11.3%, a difference of 0.080%), Immigrants from Peru (11.3%, a difference of 0.20%), Tongan (11.3%, a difference of 0.23%), Jordanian (11.3%, a difference of 0.24%), and Zimbabwean (11.3%, a difference of 0.24%).
| Demographics | Rating | Rank | Female Disability |
| Afghans | 100.0 /100 | #43 | Exceptional 11.2% |
| Cambodians | 100.0 /100 | #44 | Exceptional 11.3% |
| Immigrants | Sweden | 100.0 /100 | #45 | Exceptional 11.3% |
| Immigrants | Nepal | 100.0 /100 | #46 | Exceptional 11.3% |
| Jordanians | 100.0 /100 | #47 | Exceptional 11.3% |
| Zimbabweans | 100.0 /100 | #48 | Exceptional 11.3% |
| Tongans | 100.0 /100 | #49 | Exceptional 11.3% |
| Inupiat | 100.0 /100 | #50 | Exceptional 11.3% |
| Immigrants | Belgium | 100.0 /100 | #51 | Exceptional 11.3% |
| Immigrants | Peru | 99.9 /100 | #52 | Exceptional 11.3% |
| Immigrants | Saudi Arabia | 99.9 /100 | #53 | Exceptional 11.3% |
| Peruvians | 99.9 /100 | #54 | Exceptional 11.3% |
| Bulgarians | 99.9 /100 | #55 | Exceptional 11.3% |
| Taiwanese | 99.9 /100 | #56 | Exceptional 11.4% |
| South Americans | 99.9 /100 | #57 | Exceptional 11.4% |
Demographics Similar to Immigrants from Czechoslovakia by Female Disability
In terms of female disability, the demographic groups most similar to Immigrants from Czechoslovakia are Immigrants from Romania (11.6%, a difference of 0.010%), Immigrants from Zimbabwe (11.6%, a difference of 0.010%), Vietnamese (11.6%, a difference of 0.020%), Immigrants from Sierra Leone (11.6%, a difference of 0.10%), and Immigrants from Denmark (11.6%, a difference of 0.12%).
| Demographics | Rating | Rank | Female Disability |
| Palestinians | 99.6 /100 | #85 | Exceptional 11.6% |
| Immigrants | Cameroon | 99.6 /100 | #86 | Exceptional 11.6% |
| Immigrants | Denmark | 99.5 /100 | #87 | Exceptional 11.6% |
| Yup'ik | 99.5 /100 | #88 | Exceptional 11.6% |
| Vietnamese | 99.5 /100 | #89 | Exceptional 11.6% |
| Immigrants | Romania | 99.5 /100 | #90 | Exceptional 11.6% |
| Immigrants | Zimbabwe | 99.5 /100 | #91 | Exceptional 11.6% |
| Immigrants | Czechoslovakia | 99.5 /100 | #92 | Exceptional 11.6% |
| Immigrants | Sierra Leone | 99.4 /100 | #93 | Exceptional 11.6% |
| Immigrants | Brazil | 99.4 /100 | #94 | Exceptional 11.6% |
| Immigrants | Northern Europe | 99.4 /100 | #95 | Exceptional 11.6% |
| Immigrants | Russia | 99.0 /100 | #96 | Exceptional 11.7% |
| Koreans | 99.0 /100 | #97 | Exceptional 11.7% |
| Uruguayans | 98.8 /100 | #98 | Exceptional 11.7% |
| Immigrants | Philippines | 98.6 /100 | #99 | Exceptional 11.7% |