Inupiat vs Immigrants from Guyana Ambulatory Disability
COMPARE
Inupiat
Immigrants from Guyana
Ambulatory Disability
Ambulatory Disability Comparison
Inupiat
Immigrants from Guyana
5.6%
AMBULATORY DISABILITY
99.8/ 100
METRIC RATING
56th/ 347
METRIC RANK
6.7%
AMBULATORY DISABILITY
0.1/ 100
METRIC RATING
275th/ 347
METRIC RANK
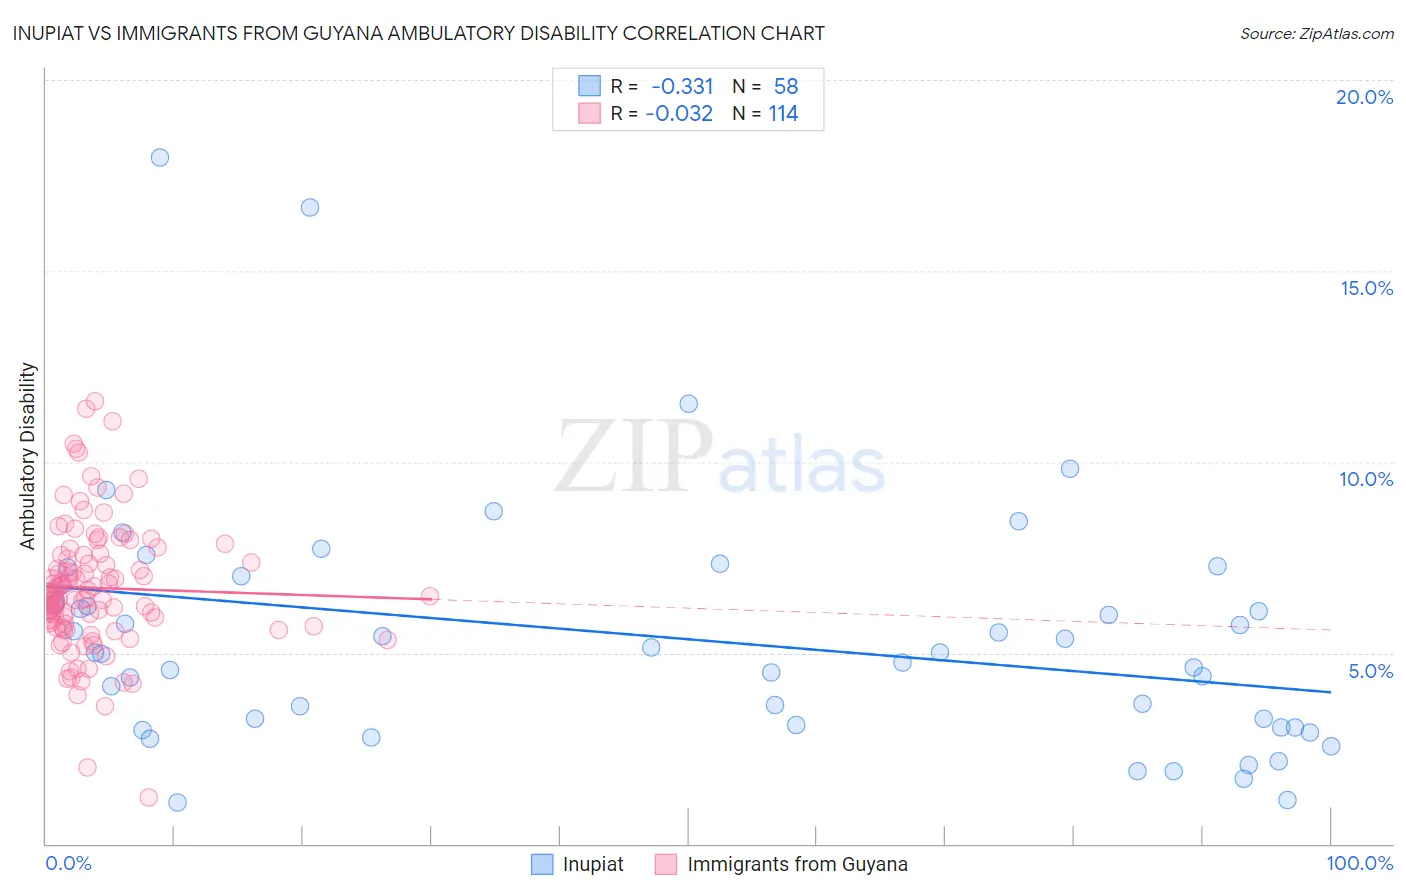
Inupiat vs Immigrants from Guyana Ambulatory Disability Correlation Chart
The statistical analysis conducted on geographies consisting of 96,327,130 people shows a mild negative correlation between the proportion of Inupiat and percentage of population with ambulatory disability in the United States with a correlation coefficient (R) of -0.331 and weighted average of 5.6%. Similarly, the statistical analysis conducted on geographies consisting of 183,703,785 people shows no correlation between the proportion of Immigrants from Guyana and percentage of population with ambulatory disability in the United States with a correlation coefficient (R) of -0.032 and weighted average of 6.7%, a difference of 19.6%.
Ambulatory Disability Correlation Summary
| Measurement | Inupiat | Immigrants from Guyana |
| Minimum | 1.1% | 1.2% |
| Maximum | 18.0% | 11.6% |
| Range | 16.9% | 10.4% |
| Mean | 5.4% | 6.7% |
| Median | 5.0% | 6.5% |
| Interquartile 25% (IQ1) | 3.1% | 5.7% |
| Interquartile 75% (IQ3) | 6.8% | 7.6% |
| Interquartile Range (IQR) | 3.7% | 1.9% |
| Standard Deviation (Sample) | 3.2% | 1.7% |
| Standard Deviation (Population) | 3.2% | 1.7% |
Similar Demographics by Ambulatory Disability
Demographics Similar to Inupiat by Ambulatory Disability
In terms of ambulatory disability, the demographic groups most similar to Inupiat are Immigrants from Bulgaria (5.6%, a difference of 0.090%), Immigrants from Eastern Africa (5.6%, a difference of 0.16%), Immigrants from Egypt (5.6%, a difference of 0.20%), Jordanian (5.6%, a difference of 0.21%), and Immigrants from Brazil (5.6%, a difference of 0.24%).
| Demographics | Rating | Rank | Ambulatory Disability |
| Bulgarians | 99.9 /100 | #49 | Exceptional 5.6% |
| Luxembourgers | 99.9 /100 | #50 | Exceptional 5.6% |
| Taiwanese | 99.8 /100 | #51 | Exceptional 5.6% |
| Jordanians | 99.8 /100 | #52 | Exceptional 5.6% |
| Immigrants | Egypt | 99.8 /100 | #53 | Exceptional 5.6% |
| Immigrants | Eastern Africa | 99.8 /100 | #54 | Exceptional 5.6% |
| Immigrants | Bulgaria | 99.8 /100 | #55 | Exceptional 5.6% |
| Inupiat | 99.8 /100 | #56 | Exceptional 5.6% |
| Immigrants | Brazil | 99.8 /100 | #57 | Exceptional 5.6% |
| Immigrants | Zimbabwe | 99.8 /100 | #58 | Exceptional 5.6% |
| Immigrants | Afghanistan | 99.8 /100 | #59 | Exceptional 5.6% |
| Immigrants | Lithuania | 99.8 /100 | #60 | Exceptional 5.6% |
| Immigrants | Belgium | 99.7 /100 | #61 | Exceptional 5.6% |
| Immigrants | Spain | 99.7 /100 | #62 | Exceptional 5.6% |
| Immigrants | France | 99.7 /100 | #63 | Exceptional 5.6% |
Demographics Similar to Immigrants from Guyana by Ambulatory Disability
In terms of ambulatory disability, the demographic groups most similar to Immigrants from Guyana are Celtic (6.7%, a difference of 0.030%), Sioux (6.7%, a difference of 0.060%), Jamaican (6.7%, a difference of 0.11%), Immigrants from West Indies (6.7%, a difference of 0.18%), and White/Caucasian (6.7%, a difference of 0.31%).
| Demographics | Rating | Rank | Ambulatory Disability |
| Spanish | 0.2 /100 | #268 | Tragic 6.6% |
| French | 0.1 /100 | #269 | Tragic 6.6% |
| Slovaks | 0.1 /100 | #270 | Tragic 6.7% |
| Immigrants | Trinidad and Tobago | 0.1 /100 | #271 | Tragic 6.7% |
| French Canadians | 0.1 /100 | #272 | Tragic 6.7% |
| Whites/Caucasians | 0.1 /100 | #273 | Tragic 6.7% |
| Sioux | 0.1 /100 | #274 | Tragic 6.7% |
| Immigrants | Guyana | 0.1 /100 | #275 | Tragic 6.7% |
| Celtics | 0.1 /100 | #276 | Tragic 6.7% |
| Jamaicans | 0.1 /100 | #277 | Tragic 6.7% |
| Immigrants | West Indies | 0.1 /100 | #278 | Tragic 6.7% |
| Immigrants | Caribbean | 0.0 /100 | #279 | Tragic 6.7% |
| Pennsylvania Germans | 0.0 /100 | #280 | Tragic 6.8% |
| Yaqui | 0.0 /100 | #281 | Tragic 6.8% |
| Barbadians | 0.0 /100 | #282 | Tragic 6.8% |