Immigrants vs Immigrants from Costa Rica Hearing Disability
COMPARE
Immigrants
Immigrants from Costa Rica
Hearing Disability
Hearing Disability Comparison
Immigrants
Immigrants from Costa Rica
2.8%
HEARING DISABILITY
90.3/ 100
METRIC RATING
116th/ 347
METRIC RANK
2.9%
HEARING DISABILITY
84.0/ 100
METRIC RATING
138th/ 347
METRIC RANK
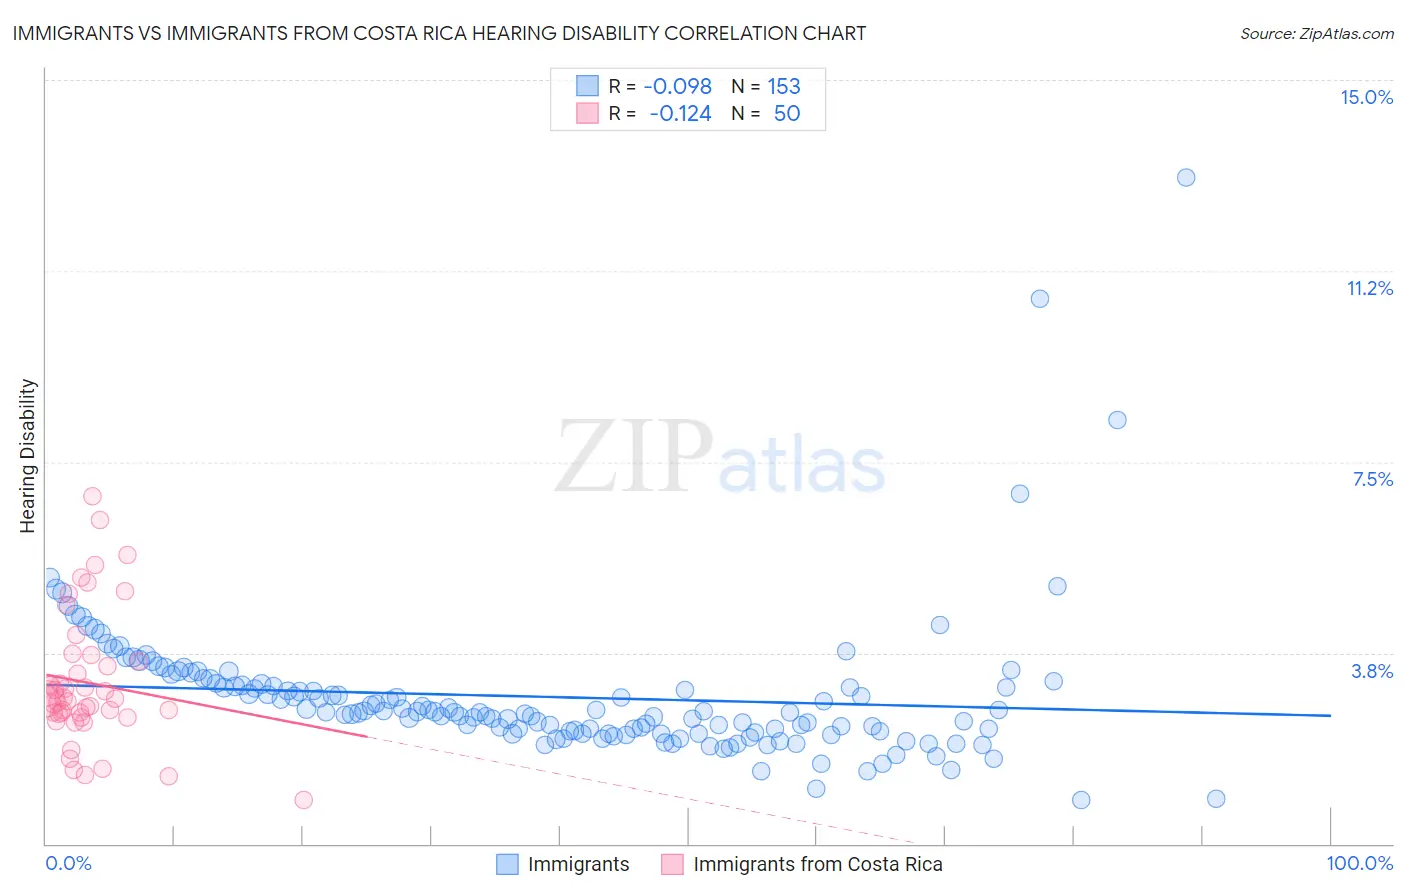
Immigrants vs Immigrants from Costa Rica Hearing Disability Correlation Chart
The statistical analysis conducted on geographies consisting of 576,876,891 people shows a slight negative correlation between the proportion of Immigrants and percentage of population with hearing disability in the United States with a correlation coefficient (R) of -0.098 and weighted average of 2.8%. Similarly, the statistical analysis conducted on geographies consisting of 204,259,714 people shows a poor negative correlation between the proportion of Immigrants from Costa Rica and percentage of population with hearing disability in the United States with a correlation coefficient (R) of -0.124 and weighted average of 2.9%, a difference of 1.4%.
Hearing Disability Correlation Summary
| Measurement | Immigrants | Immigrants from Costa Rica |
| Minimum | 0.87% | 0.86% |
| Maximum | 13.1% | 6.8% |
| Range | 12.2% | 6.0% |
| Mean | 2.9% | 3.2% |
| Median | 2.6% | 2.8% |
| Interquartile 25% (IQ1) | 2.2% | 2.5% |
| Interquartile 75% (IQ3) | 3.1% | 3.6% |
| Interquartile Range (IQR) | 0.95% | 1.1% |
| Standard Deviation (Sample) | 1.4% | 1.3% |
| Standard Deviation (Population) | 1.4% | 1.3% |
Similar Demographics by Hearing Disability
Demographics Similar to Immigrants by Hearing Disability
In terms of hearing disability, the demographic groups most similar to Immigrants are Immigrants from Latin America (2.8%, a difference of 0.060%), Immigrants from Liberia (2.8%, a difference of 0.090%), Zimbabwean (2.8%, a difference of 0.10%), Kenyan (2.8%, a difference of 0.12%), and Jordanian (2.8%, a difference of 0.21%).
| Demographics | Rating | Rank | Hearing Disability |
| Turks | 93.0 /100 | #109 | Exceptional 2.8% |
| Cypriots | 92.9 /100 | #110 | Exceptional 2.8% |
| Immigrants | Yemen | 92.7 /100 | #111 | Exceptional 2.8% |
| U.S. Virgin Islanders | 92.5 /100 | #112 | Exceptional 2.8% |
| Immigrants | Belarus | 91.6 /100 | #113 | Exceptional 2.8% |
| Cambodians | 91.1 /100 | #114 | Exceptional 2.8% |
| Immigrants | Latin America | 90.5 /100 | #115 | Exceptional 2.8% |
| Immigrants | Immigrants | 90.3 /100 | #116 | Exceptional 2.8% |
| Immigrants | Liberia | 90.0 /100 | #117 | Excellent 2.8% |
| Zimbabweans | 89.9 /100 | #118 | Excellent 2.8% |
| Kenyans | 89.8 /100 | #119 | Excellent 2.8% |
| Jordanians | 89.5 /100 | #120 | Excellent 2.8% |
| Cubans | 89.4 /100 | #121 | Excellent 2.8% |
| Liberians | 89.0 /100 | #122 | Excellent 2.8% |
| Immigrants | Zaire | 88.6 /100 | #123 | Excellent 2.9% |
Demographics Similar to Immigrants from Costa Rica by Hearing Disability
In terms of hearing disability, the demographic groups most similar to Immigrants from Costa Rica are Sri Lankan (2.9%, a difference of 0.010%), Bermudan (2.9%, a difference of 0.050%), Immigrants from Jordan (2.9%, a difference of 0.060%), Immigrants from Brazil (2.9%, a difference of 0.10%), and Soviet Union (2.9%, a difference of 0.13%).
| Demographics | Rating | Rank | Hearing Disability |
| Immigrants | Kenya | 86.1 /100 | #131 | Excellent 2.9% |
| Chileans | 85.8 /100 | #132 | Excellent 2.9% |
| Immigrants | Syria | 85.8 /100 | #133 | Excellent 2.9% |
| Ugandans | 85.5 /100 | #134 | Excellent 2.9% |
| Soviet Union | 84.8 /100 | #135 | Excellent 2.9% |
| Immigrants | Brazil | 84.6 /100 | #136 | Excellent 2.9% |
| Sri Lankans | 84.1 /100 | #137 | Excellent 2.9% |
| Immigrants | Costa Rica | 84.0 /100 | #138 | Excellent 2.9% |
| Bermudans | 83.8 /100 | #139 | Excellent 2.9% |
| Immigrants | Jordan | 83.7 /100 | #140 | Excellent 2.9% |
| Sub-Saharan Africans | 83.3 /100 | #141 | Excellent 2.9% |
| Laotians | 81.1 /100 | #142 | Excellent 2.9% |
| Immigrants | Bahamas | 80.9 /100 | #143 | Excellent 2.9% |
| Immigrants | Bulgaria | 79.2 /100 | #144 | Good 2.9% |
| Immigrants | Congo | 78.9 /100 | #145 | Good 2.9% |