Dutch West Indian vs Nonimmigrants Disability Age 5 to 17
COMPARE
Dutch West Indian
Nonimmigrants
Disability Age 5 to 17
Disability Age 5 to 17 Comparison
Dutch West Indians
Nonimmigrants
6.7%
DISABILITY AGE 5 TO 17
0.0/ 100
METRIC RATING
330th/ 347
METRIC RANK
6.3%
DISABILITY AGE 5 TO 17
0.0/ 100
METRIC RATING
306th/ 347
METRIC RANK
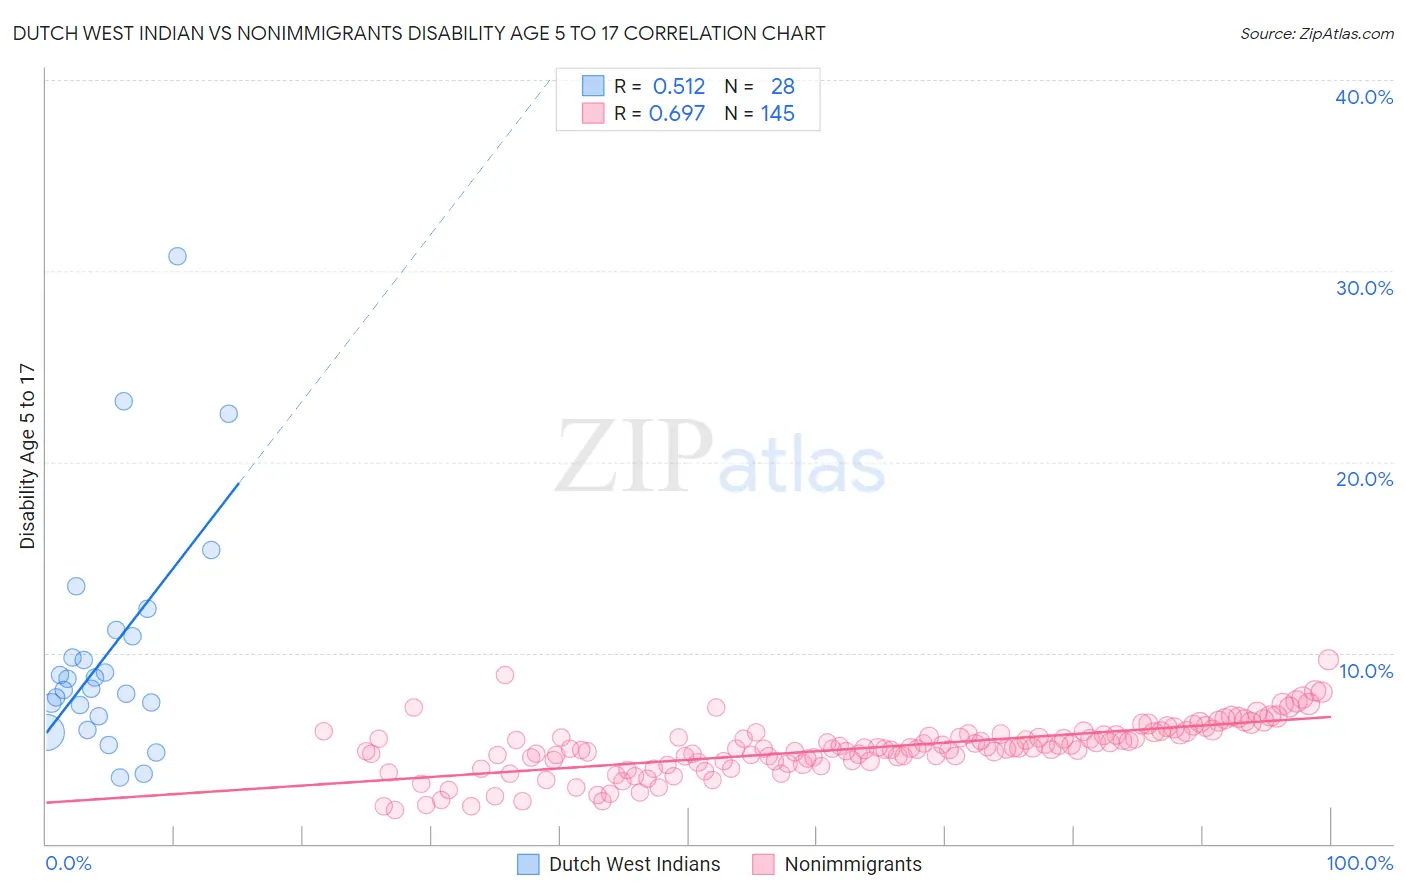
Dutch West Indian vs Nonimmigrants Disability Age 5 to 17 Correlation Chart
The statistical analysis conducted on geographies consisting of 85,576,125 people shows a substantial positive correlation between the proportion of Dutch West Indians and percentage of population with a disability between the ages 5 and 17 in the United States with a correlation coefficient (R) of 0.512 and weighted average of 6.7%. Similarly, the statistical analysis conducted on geographies consisting of 567,642,967 people shows a significant positive correlation between the proportion of Nonimmigrants and percentage of population with a disability between the ages 5 and 17 in the United States with a correlation coefficient (R) of 0.697 and weighted average of 6.3%, a difference of 6.3%.
Disability Age 5 to 17 Correlation Summary
| Measurement | Dutch West Indian | Nonimmigrants |
| Minimum | 3.5% | 1.8% |
| Maximum | 30.8% | 9.6% |
| Range | 27.3% | 7.9% |
| Mean | 10.1% | 5.0% |
| Median | 8.4% | 5.0% |
| Interquartile 25% (IQ1) | 7.0% | 4.3% |
| Interquartile 75% (IQ3) | 11.0% | 5.7% |
| Interquartile Range (IQR) | 4.1% | 1.4% |
| Standard Deviation (Sample) | 6.2% | 1.4% |
| Standard Deviation (Population) | 6.1% | 1.4% |
Similar Demographics by Disability Age 5 to 17
Demographics Similar to Dutch West Indians by Disability Age 5 to 17
In terms of disability age 5 to 17, the demographic groups most similar to Dutch West Indians are French Canadian (6.7%, a difference of 0.080%), Immigrants from the Azores (6.7%, a difference of 0.10%), Black/African American (6.8%, a difference of 0.69%), Seminole (6.8%, a difference of 0.74%), and Ottawa (6.8%, a difference of 1.5%).
| Demographics | Rating | Rank | Disability Age 5 to 17 |
| Osage | 0.0 /100 | #323 | Tragic 6.5% |
| Dominicans | 0.0 /100 | #324 | Tragic 6.5% |
| Americans | 0.0 /100 | #325 | Tragic 6.5% |
| Potawatomi | 0.0 /100 | #326 | Tragic 6.5% |
| French American Indians | 0.0 /100 | #327 | Tragic 6.6% |
| Pennsylvania Germans | 0.0 /100 | #328 | Tragic 6.6% |
| Blackfeet | 0.0 /100 | #329 | Tragic 6.6% |
| Dutch West Indians | 0.0 /100 | #330 | Tragic 6.7% |
| French Canadians | 0.0 /100 | #331 | Tragic 6.7% |
| Immigrants | Azores | 0.0 /100 | #332 | Tragic 6.7% |
| Blacks/African Americans | 0.0 /100 | #333 | Tragic 6.8% |
| Seminole | 0.0 /100 | #334 | Tragic 6.8% |
| Ottawa | 0.0 /100 | #335 | Tragic 6.8% |
| Chickasaw | 0.0 /100 | #336 | Tragic 6.8% |
| Creek | 0.0 /100 | #337 | Tragic 6.9% |
Demographics Similar to Nonimmigrants by Disability Age 5 to 17
In terms of disability age 5 to 17, the demographic groups most similar to Nonimmigrants are Native/Alaskan (6.3%, a difference of 0.10%), Bahamian (6.3%, a difference of 0.14%), Senegalese (6.3%, a difference of 0.24%), Yakama (6.3%, a difference of 0.32%), and Scotch-Irish (6.3%, a difference of 0.37%).
| Demographics | Rating | Rank | Disability Age 5 to 17 |
| Welsh | 0.0 /100 | #299 | Tragic 6.3% |
| Carpatho Rusyns | 0.0 /100 | #300 | Tragic 6.3% |
| U.S. Virgin Islanders | 0.0 /100 | #301 | Tragic 6.3% |
| Celtics | 0.0 /100 | #302 | Tragic 6.3% |
| Yakama | 0.0 /100 | #303 | Tragic 6.3% |
| Senegalese | 0.0 /100 | #304 | Tragic 6.3% |
| Natives/Alaskans | 0.0 /100 | #305 | Tragic 6.3% |
| Immigrants | Nonimmigrants | 0.0 /100 | #306 | Tragic 6.3% |
| Bahamians | 0.0 /100 | #307 | Tragic 6.3% |
| Scotch-Irish | 0.0 /100 | #308 | Tragic 6.3% |
| Hmong | 0.0 /100 | #309 | Tragic 6.3% |
| Alaskan Athabascans | 0.0 /100 | #310 | Tragic 6.3% |
| Immigrants | Dominica | 0.0 /100 | #311 | Tragic 6.3% |
| Bermudans | 0.0 /100 | #312 | Tragic 6.4% |
| Apache | 0.0 /100 | #313 | Tragic 6.4% |