Immigrants from Zimbabwe vs Colville Unemployment Among Ages 65 to 74 years
COMPARE
Immigrants from Zimbabwe
Colville
Unemployment Among Ages 65 to 74 years
Unemployment Among Ages 65 to 74 years Comparison
Immigrants from Zimbabwe
Colville
5.1%
UNEMPLOYMENT AMONG AGES 65 TO 74 YEARS
99.7/ 100
METRIC RATING
50th/ 347
METRIC RANK
5.4%
UNEMPLOYMENT AMONG AGES 65 TO 74 YEARS
20.4/ 100
METRIC RATING
197th/ 347
METRIC RANK
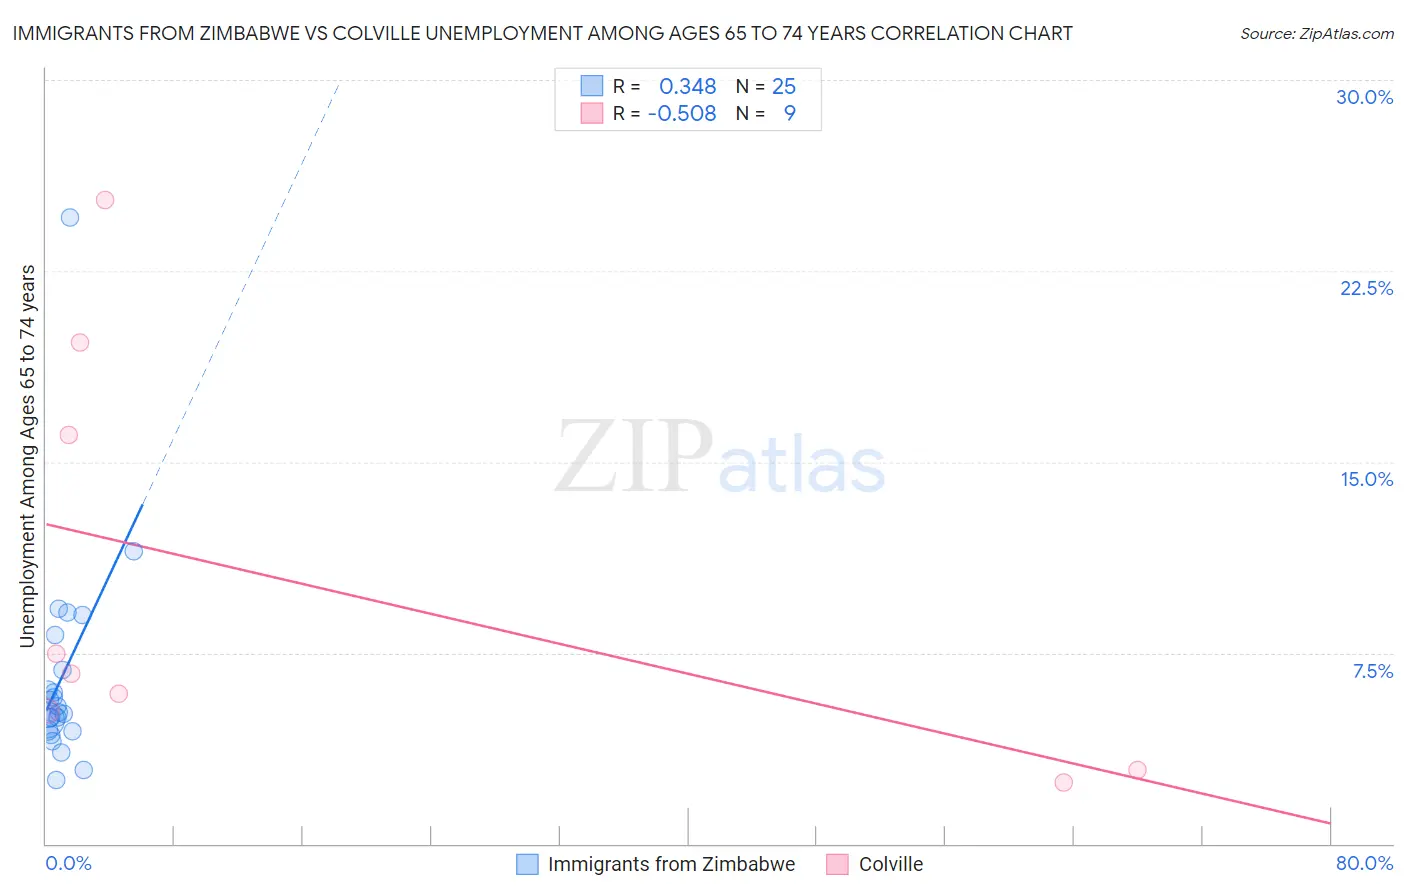
Immigrants from Zimbabwe vs Colville Unemployment Among Ages 65 to 74 years Correlation Chart
The statistical analysis conducted on geographies consisting of 113,363,139 people shows a mild positive correlation between the proportion of Immigrants from Zimbabwe and unemployment rate among population between the ages 65 and 74 in the United States with a correlation coefficient (R) of 0.348 and weighted average of 5.1%. Similarly, the statistical analysis conducted on geographies consisting of 33,027,474 people shows a substantial negative correlation between the proportion of Colville and unemployment rate among population between the ages 65 and 74 in the United States with a correlation coefficient (R) of -0.508 and weighted average of 5.4%, a difference of 6.3%.
Unemployment Among Ages 65 to 74 years Correlation Summary
| Measurement | Immigrants from Zimbabwe | Colville |
| Minimum | 2.5% | 2.4% |
| Maximum | 24.6% | 25.3% |
| Range | 22.1% | 22.9% |
| Mean | 6.5% | 10.2% |
| Median | 5.2% | 6.7% |
| Interquartile 25% (IQ1) | 4.4% | 4.0% |
| Interquartile 75% (IQ3) | 7.5% | 17.9% |
| Interquartile Range (IQR) | 3.1% | 13.8% |
| Standard Deviation (Sample) | 4.3% | 8.1% |
| Standard Deviation (Population) | 4.2% | 7.7% |
Similar Demographics by Unemployment Among Ages 65 to 74 years
Demographics Similar to Immigrants from Zimbabwe by Unemployment Among Ages 65 to 74 years
In terms of unemployment among ages 65 to 74 years, the demographic groups most similar to Immigrants from Zimbabwe are Immigrants from Kazakhstan (5.1%, a difference of 0.020%), Immigrants from Austria (5.1%, a difference of 0.16%), Choctaw (5.1%, a difference of 0.18%), European (5.1%, a difference of 0.29%), and Immigrants from Ethiopia (5.1%, a difference of 0.29%).
| Demographics | Rating | Rank | Unemployment Among Ages 65 to 74 years |
| Assyrians/Chaldeans/Syriacs | 99.9 /100 | #43 | Exceptional 5.1% |
| Immigrants | India | 99.9 /100 | #44 | Exceptional 5.1% |
| Sioux | 99.8 /100 | #45 | Exceptional 5.1% |
| Immigrants | Kenya | 99.8 /100 | #46 | Exceptional 5.1% |
| Immigrants | Uganda | 99.8 /100 | #47 | Exceptional 5.1% |
| Choctaw | 99.8 /100 | #48 | Exceptional 5.1% |
| Immigrants | Austria | 99.8 /100 | #49 | Exceptional 5.1% |
| Immigrants | Zimbabwe | 99.7 /100 | #50 | Exceptional 5.1% |
| Immigrants | Kazakhstan | 99.7 /100 | #51 | Exceptional 5.1% |
| Europeans | 99.6 /100 | #52 | Exceptional 5.1% |
| Immigrants | Ethiopia | 99.6 /100 | #53 | Exceptional 5.1% |
| Immigrants | Nicaragua | 99.6 /100 | #54 | Exceptional 5.1% |
| Carpatho Rusyns | 99.6 /100 | #55 | Exceptional 5.1% |
| Swedes | 99.5 /100 | #56 | Exceptional 5.1% |
| Croatians | 99.5 /100 | #57 | Exceptional 5.1% |
Demographics Similar to Colville by Unemployment Among Ages 65 to 74 years
In terms of unemployment among ages 65 to 74 years, the demographic groups most similar to Colville are Costa Rican (5.4%, a difference of 0.030%), Albanian (5.4%, a difference of 0.14%), Immigrants from China (5.4%, a difference of 0.18%), Immigrants from Denmark (5.4%, a difference of 0.20%), and Immigrants from Belgium (5.4%, a difference of 0.23%).
| Demographics | Rating | Rank | Unemployment Among Ages 65 to 74 years |
| Basques | 26.6 /100 | #190 | Fair 5.4% |
| Immigrants | Egypt | 26.5 /100 | #191 | Fair 5.4% |
| Maltese | 26.4 /100 | #192 | Fair 5.4% |
| Cherokee | 25.8 /100 | #193 | Fair 5.4% |
| Immigrants | Denmark | 24.7 /100 | #194 | Fair 5.4% |
| Immigrants | China | 24.2 /100 | #195 | Fair 5.4% |
| Costa Ricans | 21.1 /100 | #196 | Fair 5.4% |
| Colville | 20.4 /100 | #197 | Fair 5.4% |
| Albanians | 17.8 /100 | #198 | Poor 5.4% |
| Immigrants | Belgium | 16.2 /100 | #199 | Poor 5.4% |
| Immigrants | Pakistan | 15.2 /100 | #200 | Poor 5.4% |
| Immigrants | Western Asia | 14.9 /100 | #201 | Poor 5.4% |
| Sub-Saharan Africans | 14.4 /100 | #202 | Poor 5.4% |
| Argentineans | 14.3 /100 | #203 | Poor 5.4% |
| Seminole | 14.3 /100 | #204 | Poor 5.4% |