Immigrants from Zimbabwe vs Immigrants from El Salvador Male Disability
COMPARE
Immigrants from Zimbabwe
Immigrants from El Salvador
Male Disability
Male Disability Comparison
Immigrants from Zimbabwe
Immigrants from El Salvador
10.8%
MALE DISABILITY
93.0/ 100
METRIC RATING
113th/ 347
METRIC RANK
10.3%
MALE DISABILITY
99.7/ 100
METRIC RATING
44th/ 347
METRIC RANK
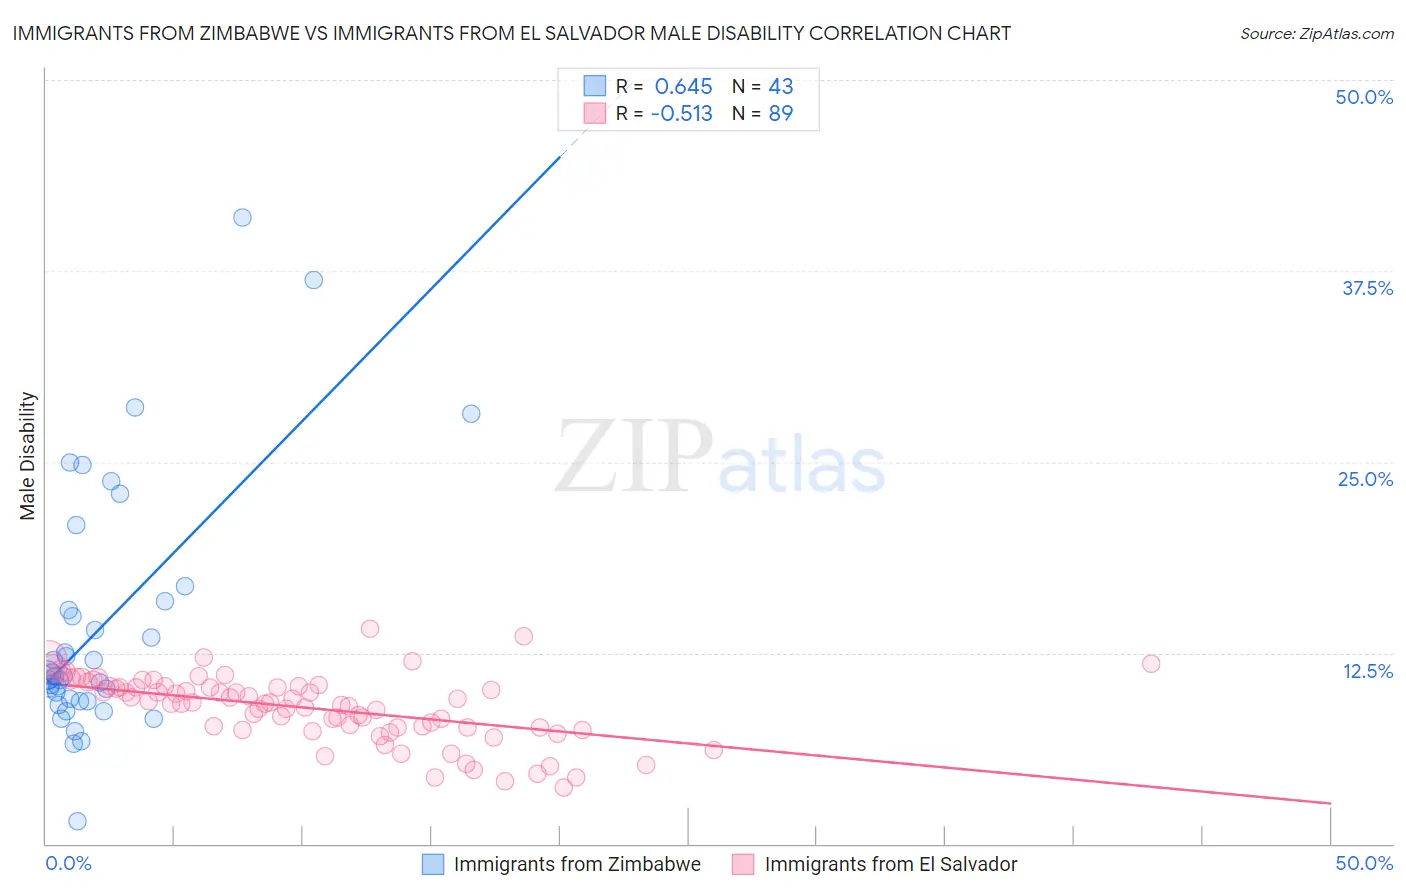
Immigrants from Zimbabwe vs Immigrants from El Salvador Male Disability Correlation Chart
The statistical analysis conducted on geographies consisting of 117,811,453 people shows a significant positive correlation between the proportion of Immigrants from Zimbabwe and percentage of males with a disability in the United States with a correlation coefficient (R) of 0.645 and weighted average of 10.8%. Similarly, the statistical analysis conducted on geographies consisting of 357,750,884 people shows a substantial negative correlation between the proportion of Immigrants from El Salvador and percentage of males with a disability in the United States with a correlation coefficient (R) of -0.513 and weighted average of 10.3%, a difference of 5.0%.
Male Disability Correlation Summary
| Measurement | Immigrants from Zimbabwe | Immigrants from El Salvador |
| Minimum | 1.5% | 3.7% |
| Maximum | 41.0% | 14.1% |
| Range | 39.5% | 10.4% |
| Mean | 14.2% | 8.9% |
| Median | 11.0% | 9.2% |
| Interquartile 25% (IQ1) | 9.4% | 7.6% |
| Interquartile 75% (IQ3) | 15.9% | 10.3% |
| Interquartile Range (IQR) | 6.5% | 2.7% |
| Standard Deviation (Sample) | 8.2% | 2.2% |
| Standard Deviation (Population) | 8.1% | 2.2% |
Similar Demographics by Male Disability
Demographics Similar to Immigrants from Zimbabwe by Male Disability
In terms of male disability, the demographic groups most similar to Immigrants from Zimbabwe are Central American (10.8%, a difference of 0.070%), Ghanaian (10.8%, a difference of 0.090%), Immigrants from Barbados (10.8%, a difference of 0.16%), Immigrants from Uruguay (10.8%, a difference of 0.18%), and Immigrants (10.8%, a difference of 0.22%).
| Demographics | Rating | Rank | Male Disability |
| Immigrants | Syria | 94.9 /100 | #106 | Exceptional 10.8% |
| Immigrants | Eastern Africa | 94.3 /100 | #107 | Exceptional 10.8% |
| Immigrants | Belgium | 94.2 /100 | #108 | Exceptional 10.8% |
| Immigrants | Uganda | 94.0 /100 | #109 | Exceptional 10.8% |
| Immigrants | Immigrants | 93.9 /100 | #110 | Exceptional 10.8% |
| Immigrants | Uruguay | 93.8 /100 | #111 | Exceptional 10.8% |
| Ghanaians | 93.4 /100 | #112 | Exceptional 10.8% |
| Immigrants | Zimbabwe | 93.0 /100 | #113 | Exceptional 10.8% |
| Central Americans | 92.7 /100 | #114 | Exceptional 10.8% |
| Immigrants | Barbados | 92.2 /100 | #115 | Exceptional 10.8% |
| Immigrants | South Africa | 91.8 /100 | #116 | Exceptional 10.8% |
| Eastern Europeans | 90.6 /100 | #117 | Exceptional 10.9% |
| Immigrants | Cuba | 90.2 /100 | #118 | Exceptional 10.9% |
| Armenians | 90.1 /100 | #119 | Exceptional 10.9% |
| Immigrants | Africa | 89.4 /100 | #120 | Excellent 10.9% |
Demographics Similar to Immigrants from El Salvador by Male Disability
In terms of male disability, the demographic groups most similar to Immigrants from El Salvador are Turkish (10.3%, a difference of 0.0%), Immigrants from Bangladesh (10.3%, a difference of 0.070%), Mongolian (10.3%, a difference of 0.090%), Cambodian (10.3%, a difference of 0.090%), and Immigrants from Peru (10.3%, a difference of 0.12%).
| Demographics | Rating | Rank | Male Disability |
| Immigrants | Indonesia | 99.8 /100 | #37 | Exceptional 10.2% |
| Immigrants | Kuwait | 99.8 /100 | #38 | Exceptional 10.2% |
| Afghans | 99.8 /100 | #39 | Exceptional 10.2% |
| Immigrants | Nepal | 99.8 /100 | #40 | Exceptional 10.3% |
| Taiwanese | 99.8 /100 | #41 | Exceptional 10.3% |
| Mongolians | 99.7 /100 | #42 | Exceptional 10.3% |
| Immigrants | Bangladesh | 99.7 /100 | #43 | Exceptional 10.3% |
| Immigrants | El Salvador | 99.7 /100 | #44 | Exceptional 10.3% |
| Turks | 99.7 /100 | #45 | Exceptional 10.3% |
| Cambodians | 99.7 /100 | #46 | Exceptional 10.3% |
| Immigrants | Peru | 99.7 /100 | #47 | Exceptional 10.3% |
| Israelis | 99.7 /100 | #48 | Exceptional 10.3% |
| Immigrants | Spain | 99.7 /100 | #49 | Exceptional 10.3% |
| South Americans | 99.6 /100 | #50 | Exceptional 10.3% |
| Salvadorans | 99.6 /100 | #51 | Exceptional 10.4% |