Immigrants from Zimbabwe vs Alaska Native Male Disability
COMPARE
Immigrants from Zimbabwe
Alaska Native
Male Disability
Male Disability Comparison
Immigrants from Zimbabwe
Alaska Natives
10.8%
MALE DISABILITY
93.0/ 100
METRIC RATING
113th/ 347
METRIC RANK
13.6%
MALE DISABILITY
0.0/ 100
METRIC RATING
316th/ 347
METRIC RANK
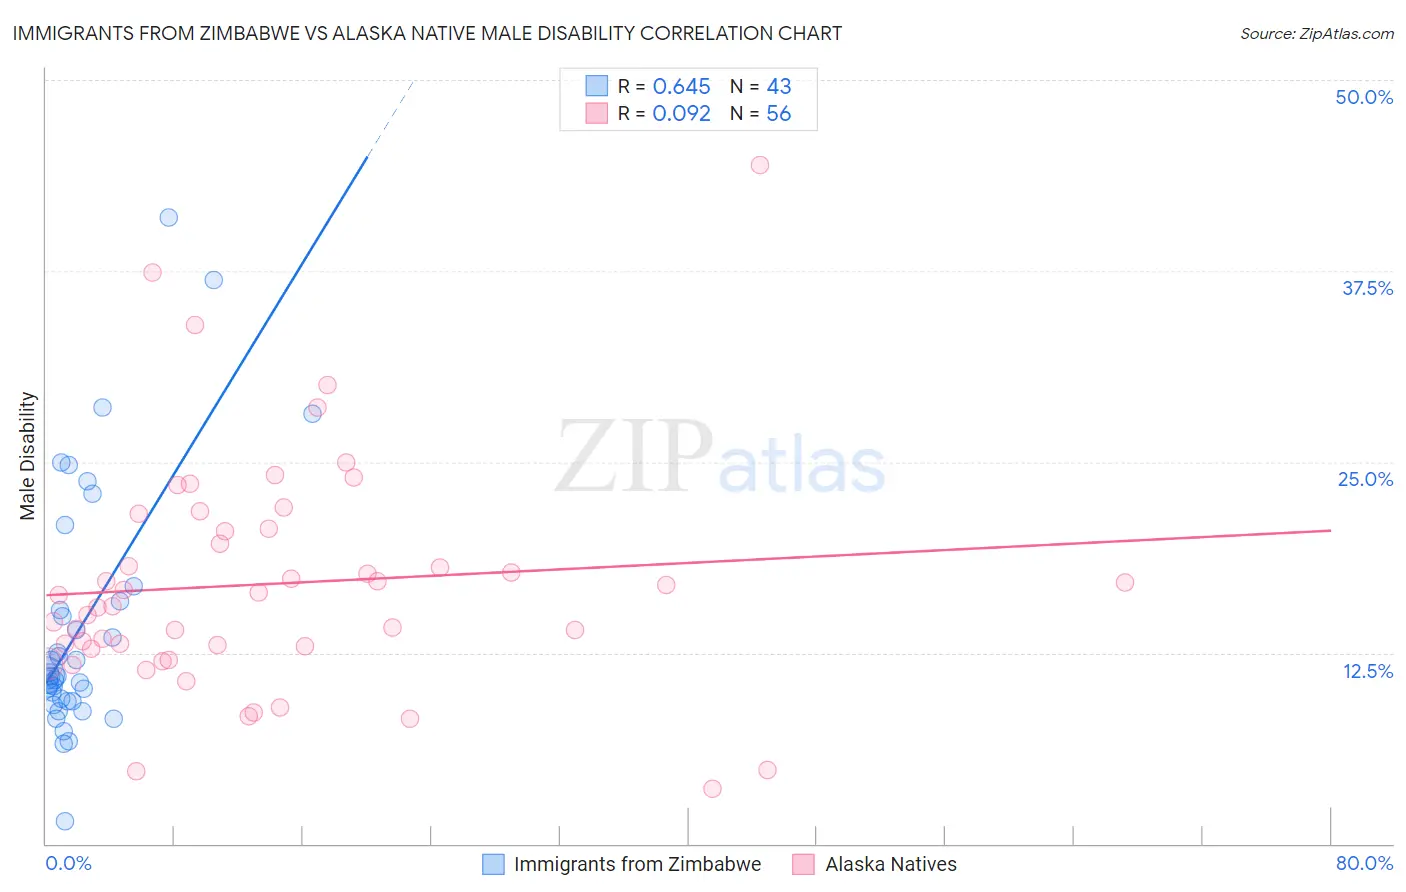
Immigrants from Zimbabwe vs Alaska Native Male Disability Correlation Chart
The statistical analysis conducted on geographies consisting of 117,811,453 people shows a significant positive correlation between the proportion of Immigrants from Zimbabwe and percentage of males with a disability in the United States with a correlation coefficient (R) of 0.645 and weighted average of 10.8%. Similarly, the statistical analysis conducted on geographies consisting of 76,765,214 people shows a slight positive correlation between the proportion of Alaska Natives and percentage of males with a disability in the United States with a correlation coefficient (R) of 0.092 and weighted average of 13.6%, a difference of 25.5%.
Male Disability Correlation Summary
| Measurement | Immigrants from Zimbabwe | Alaska Native |
| Minimum | 1.5% | 3.6% |
| Maximum | 41.0% | 44.4% |
| Range | 39.5% | 40.8% |
| Mean | 14.2% | 17.0% |
| Median | 11.0% | 15.9% |
| Interquartile 25% (IQ1) | 9.4% | 12.8% |
| Interquartile 75% (IQ3) | 15.9% | 20.5% |
| Interquartile Range (IQR) | 6.5% | 7.7% |
| Standard Deviation (Sample) | 8.2% | 7.6% |
| Standard Deviation (Population) | 8.1% | 7.6% |
Similar Demographics by Male Disability
Demographics Similar to Immigrants from Zimbabwe by Male Disability
In terms of male disability, the demographic groups most similar to Immigrants from Zimbabwe are Central American (10.8%, a difference of 0.070%), Ghanaian (10.8%, a difference of 0.090%), Immigrants from Barbados (10.8%, a difference of 0.16%), Immigrants from Uruguay (10.8%, a difference of 0.18%), and Immigrants (10.8%, a difference of 0.22%).
| Demographics | Rating | Rank | Male Disability |
| Immigrants | Syria | 94.9 /100 | #106 | Exceptional 10.8% |
| Immigrants | Eastern Africa | 94.3 /100 | #107 | Exceptional 10.8% |
| Immigrants | Belgium | 94.2 /100 | #108 | Exceptional 10.8% |
| Immigrants | Uganda | 94.0 /100 | #109 | Exceptional 10.8% |
| Immigrants | Immigrants | 93.9 /100 | #110 | Exceptional 10.8% |
| Immigrants | Uruguay | 93.8 /100 | #111 | Exceptional 10.8% |
| Ghanaians | 93.4 /100 | #112 | Exceptional 10.8% |
| Immigrants | Zimbabwe | 93.0 /100 | #113 | Exceptional 10.8% |
| Central Americans | 92.7 /100 | #114 | Exceptional 10.8% |
| Immigrants | Barbados | 92.2 /100 | #115 | Exceptional 10.8% |
| Immigrants | South Africa | 91.8 /100 | #116 | Exceptional 10.8% |
| Eastern Europeans | 90.6 /100 | #117 | Exceptional 10.9% |
| Immigrants | Cuba | 90.2 /100 | #118 | Exceptional 10.9% |
| Armenians | 90.1 /100 | #119 | Exceptional 10.9% |
| Immigrants | Africa | 89.4 /100 | #120 | Excellent 10.9% |
Demographics Similar to Alaska Natives by Male Disability
In terms of male disability, the demographic groups most similar to Alaska Natives are Iroquois (13.6%, a difference of 0.050%), Aleut (13.5%, a difference of 0.21%), Puget Sound Salish (13.5%, a difference of 0.27%), Yakama (13.5%, a difference of 0.29%), and Paiute (13.7%, a difference of 0.80%).
| Demographics | Rating | Rank | Male Disability |
| Blackfeet | 0.0 /100 | #309 | Tragic 13.4% |
| Immigrants | Azores | 0.0 /100 | #310 | Tragic 13.4% |
| Delaware | 0.0 /100 | #311 | Tragic 13.5% |
| Yakama | 0.0 /100 | #312 | Tragic 13.5% |
| Puget Sound Salish | 0.0 /100 | #313 | Tragic 13.5% |
| Aleuts | 0.0 /100 | #314 | Tragic 13.5% |
| Iroquois | 0.0 /100 | #315 | Tragic 13.6% |
| Alaska Natives | 0.0 /100 | #316 | Tragic 13.6% |
| Paiute | 0.0 /100 | #317 | Tragic 13.7% |
| Cree | 0.0 /100 | #318 | Tragic 13.7% |
| Americans | 0.0 /100 | #319 | Tragic 13.8% |
| Tlingit-Haida | 0.0 /100 | #320 | Tragic 13.8% |
| Shoshone | 0.0 /100 | #321 | Tragic 13.8% |
| Apache | 0.0 /100 | #322 | Tragic 14.0% |
| Osage | 0.0 /100 | #323 | Tragic 14.0% |