Immigrants from Zimbabwe vs Colville Cognitive Disability
COMPARE
Immigrants from Zimbabwe
Colville
Cognitive Disability
Cognitive Disability Comparison
Immigrants from Zimbabwe
Colville
17.5%
COGNITIVE DISABILITY
11.0/ 100
METRIC RATING
204th/ 347
METRIC RANK
18.3%
COGNITIVE DISABILITY
0.0/ 100
METRIC RATING
305th/ 347
METRIC RANK
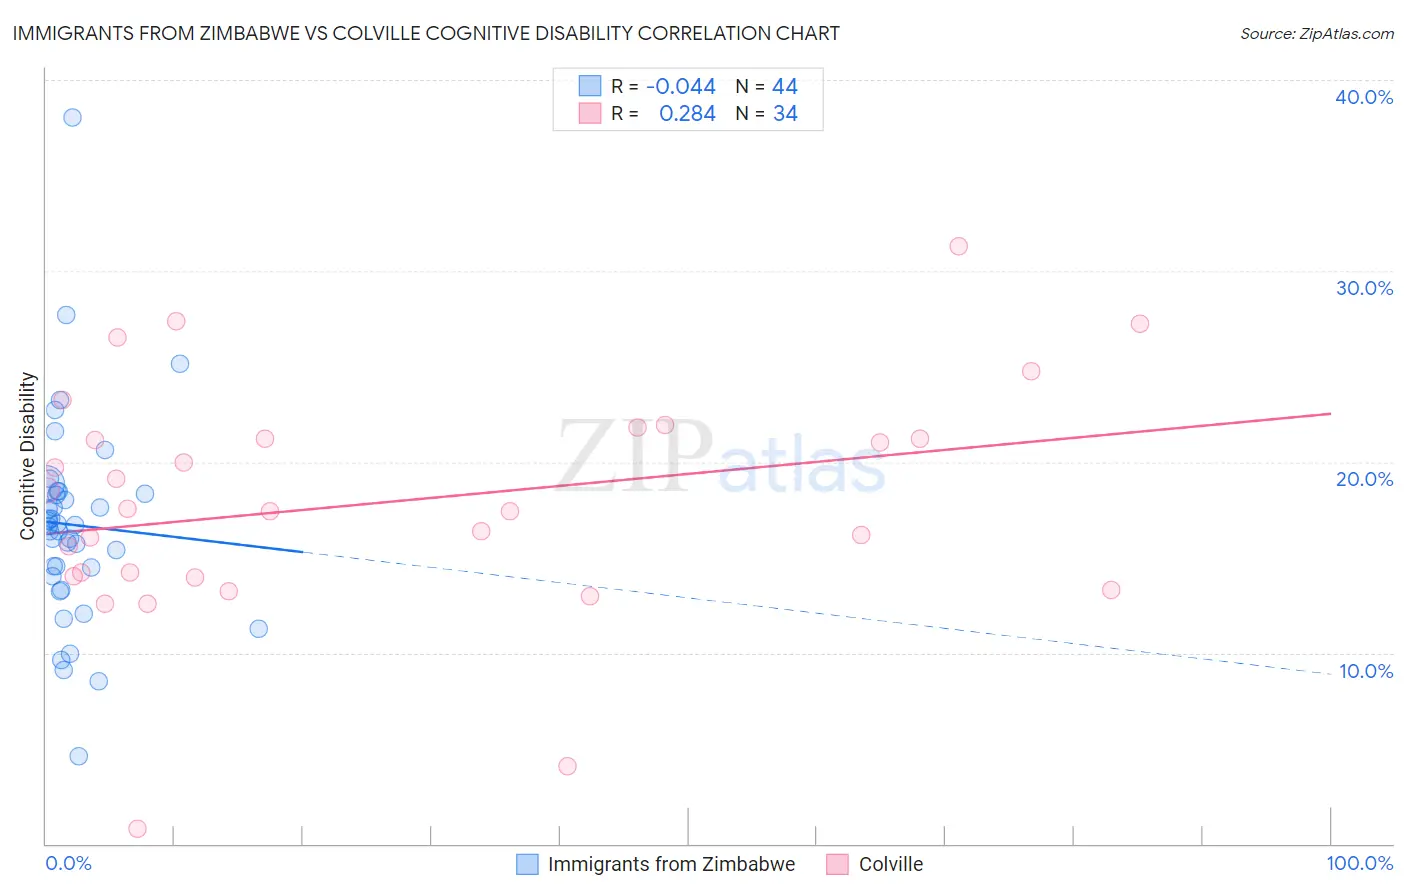
Immigrants from Zimbabwe vs Colville Cognitive Disability Correlation Chart
The statistical analysis conducted on geographies consisting of 117,811,650 people shows no correlation between the proportion of Immigrants from Zimbabwe and percentage of population with cognitive disability in the United States with a correlation coefficient (R) of -0.044 and weighted average of 17.5%. Similarly, the statistical analysis conducted on geographies consisting of 34,687,480 people shows a weak positive correlation between the proportion of Colville and percentage of population with cognitive disability in the United States with a correlation coefficient (R) of 0.284 and weighted average of 18.3%, a difference of 4.6%.
Cognitive Disability Correlation Summary
| Measurement | Immigrants from Zimbabwe | Colville |
| Minimum | 4.6% | 0.79% |
| Maximum | 38.0% | 31.3% |
| Range | 33.5% | 30.5% |
| Mean | 16.7% | 17.9% |
| Median | 16.7% | 17.5% |
| Interquartile 25% (IQ1) | 14.2% | 14.0% |
| Interquartile 75% (IQ3) | 18.4% | 21.2% |
| Interquartile Range (IQR) | 4.2% | 7.2% |
| Standard Deviation (Sample) | 5.5% | 6.2% |
| Standard Deviation (Population) | 5.4% | 6.1% |
Similar Demographics by Cognitive Disability
Demographics Similar to Immigrants from Zimbabwe by Cognitive Disability
In terms of cognitive disability, the demographic groups most similar to Immigrants from Zimbabwe are Immigrants from Caribbean (17.5%, a difference of 0.0%), Puget Sound Salish (17.5%, a difference of 0.010%), Alaska Native (17.5%, a difference of 0.040%), Immigrants from Morocco (17.5%, a difference of 0.070%), and Immigrants from Latin America (17.6%, a difference of 0.10%).
| Demographics | Rating | Rank | Cognitive Disability |
| Immigrants | Afghanistan | 16.7 /100 | #197 | Poor 17.5% |
| Immigrants | Panama | 14.8 /100 | #198 | Poor 17.5% |
| Immigrants | Singapore | 14.3 /100 | #199 | Poor 17.5% |
| Haitians | 14.1 /100 | #200 | Poor 17.5% |
| South American Indians | 13.0 /100 | #201 | Poor 17.5% |
| Immigrants | Morocco | 12.0 /100 | #202 | Poor 17.5% |
| Immigrants | Caribbean | 11.0 /100 | #203 | Poor 17.5% |
| Immigrants | Zimbabwe | 11.0 /100 | #204 | Poor 17.5% |
| Puget Sound Salish | 10.9 /100 | #205 | Poor 17.5% |
| Alaska Natives | 10.4 /100 | #206 | Poor 17.5% |
| Immigrants | Latin America | 9.7 /100 | #207 | Tragic 17.6% |
| Immigrants | Cameroon | 9.3 /100 | #208 | Tragic 17.6% |
| Immigrants | Trinidad and Tobago | 8.7 /100 | #209 | Tragic 17.6% |
| Immigrants | Jamaica | 8.5 /100 | #210 | Tragic 17.6% |
| Taiwanese | 7.7 /100 | #211 | Tragic 17.6% |
Demographics Similar to Colville by Cognitive Disability
In terms of cognitive disability, the demographic groups most similar to Colville are Seminole (18.3%, a difference of 0.010%), Ugandan (18.3%, a difference of 0.010%), Immigrants from Western Africa (18.4%, a difference of 0.10%), Immigrants from Eritrea (18.3%, a difference of 0.12%), and Immigrants from Eastern Africa (18.4%, a difference of 0.14%).
| Demographics | Rating | Rank | Cognitive Disability |
| Japanese | 0.0 /100 | #298 | Tragic 18.3% |
| Ghanaians | 0.0 /100 | #299 | Tragic 18.3% |
| Creek | 0.0 /100 | #300 | Tragic 18.3% |
| Immigrants | Ghana | 0.0 /100 | #301 | Tragic 18.3% |
| Barbadians | 0.0 /100 | #302 | Tragic 18.3% |
| Immigrants | Kenya | 0.0 /100 | #303 | Tragic 18.3% |
| Immigrants | Eritrea | 0.0 /100 | #304 | Tragic 18.3% |
| Colville | 0.0 /100 | #305 | Tragic 18.3% |
| Seminole | 0.0 /100 | #306 | Tragic 18.3% |
| Ugandans | 0.0 /100 | #307 | Tragic 18.3% |
| Immigrants | Western Africa | 0.0 /100 | #308 | Tragic 18.4% |
| Immigrants | Eastern Africa | 0.0 /100 | #309 | Tragic 18.4% |
| Choctaw | 0.0 /100 | #310 | Tragic 18.4% |
| Hmong | 0.0 /100 | #311 | Tragic 18.4% |
| Chickasaw | 0.0 /100 | #312 | Tragic 18.5% |