Immigrants from Zaire vs Immigrants from Uzbekistan Disability Age 5 to 17
COMPARE
Immigrants from Zaire
Immigrants from Uzbekistan
Disability Age 5 to 17
Disability Age 5 to 17 Comparison
Immigrants from Zaire
Immigrants from Uzbekistan
6.0%
DISABILITY AGE 5 TO 17
0.2/ 100
METRIC RATING
271st/ 347
METRIC RANK
4.8%
DISABILITY AGE 5 TO 17
100.0/ 100
METRIC RATING
19th/ 347
METRIC RANK
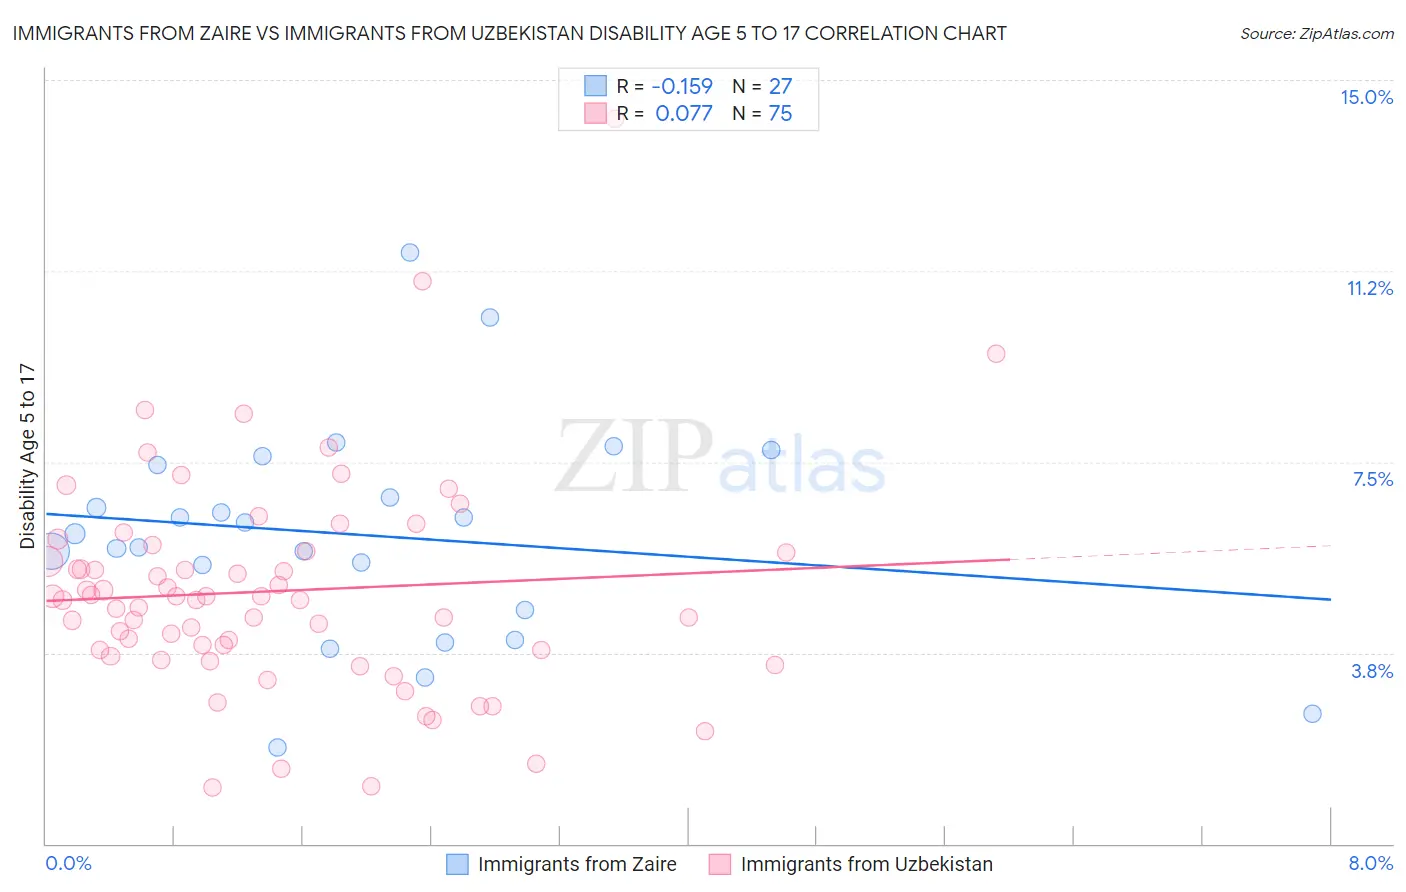
Immigrants from Zaire vs Immigrants from Uzbekistan Disability Age 5 to 17 Correlation Chart
The statistical analysis conducted on geographies consisting of 107,054,393 people shows a poor negative correlation between the proportion of Immigrants from Zaire and percentage of population with a disability between the ages 5 and 17 in the United States with a correlation coefficient (R) of -0.159 and weighted average of 6.0%. Similarly, the statistical analysis conducted on geographies consisting of 118,326,230 people shows a slight positive correlation between the proportion of Immigrants from Uzbekistan and percentage of population with a disability between the ages 5 and 17 in the United States with a correlation coefficient (R) of 0.077 and weighted average of 4.8%, a difference of 26.6%.
Disability Age 5 to 17 Correlation Summary
| Measurement | Immigrants from Zaire | Immigrants from Uzbekistan |
| Minimum | 1.9% | 1.1% |
| Maximum | 11.6% | 14.2% |
| Range | 9.7% | 13.1% |
| Mean | 6.1% | 5.0% |
| Median | 6.1% | 4.8% |
| Interquartile 25% (IQ1) | 4.6% | 3.8% |
| Interquartile 75% (IQ3) | 7.4% | 5.7% |
| Interquartile Range (IQR) | 2.8% | 1.9% |
| Standard Deviation (Sample) | 2.1% | 2.1% |
| Standard Deviation (Population) | 2.1% | 2.1% |
Similar Demographics by Disability Age 5 to 17
Demographics Similar to Immigrants from Zaire by Disability Age 5 to 17
In terms of disability age 5 to 17, the demographic groups most similar to Immigrants from Zaire are Finnish (6.0%, a difference of 0.030%), Alaska Native (6.0%, a difference of 0.080%), Cheyenne (6.0%, a difference of 0.19%), Dutch (6.0%, a difference of 0.30%), and Japanese (6.1%, a difference of 0.40%).
| Demographics | Rating | Rank | Disability Age 5 to 17 |
| Canadians | 0.6 /100 | #264 | Tragic 6.0% |
| Panamanians | 0.6 /100 | #265 | Tragic 6.0% |
| Slovenes | 0.6 /100 | #266 | Tragic 6.0% |
| Spanish | 0.5 /100 | #267 | Tragic 6.0% |
| Sioux | 0.4 /100 | #268 | Tragic 6.0% |
| Liberians | 0.4 /100 | #269 | Tragic 6.0% |
| Immigrants | Somalia | 0.4 /100 | #270 | Tragic 6.0% |
| Immigrants | Zaire | 0.2 /100 | #271 | Tragic 6.0% |
| Finns | 0.2 /100 | #272 | Tragic 6.0% |
| Alaska Natives | 0.2 /100 | #273 | Tragic 6.0% |
| Cheyenne | 0.2 /100 | #274 | Tragic 6.0% |
| Dutch | 0.2 /100 | #275 | Tragic 6.0% |
| Japanese | 0.1 /100 | #276 | Tragic 6.1% |
| Puget Sound Salish | 0.1 /100 | #277 | Tragic 6.1% |
| Immigrants | Liberia | 0.1 /100 | #278 | Tragic 6.1% |
Demographics Similar to Immigrants from Uzbekistan by Disability Age 5 to 17
In terms of disability age 5 to 17, the demographic groups most similar to Immigrants from Uzbekistan are Burmese (4.8%, a difference of 0.38%), Immigrants from South Central Asia (4.7%, a difference of 0.49%), Arapaho (4.7%, a difference of 0.51%), Yup'ik (4.8%, a difference of 0.60%), and Asian (4.8%, a difference of 0.94%).
| Demographics | Rating | Rank | Disability Age 5 to 17 |
| Iranians | 100.0 /100 | #12 | Exceptional 4.6% |
| Thais | 100.0 /100 | #13 | Exceptional 4.7% |
| Immigrants | Korea | 100.0 /100 | #14 | Exceptional 4.7% |
| Chinese | 100.0 /100 | #15 | Exceptional 4.7% |
| Immigrants | Singapore | 100.0 /100 | #16 | Exceptional 4.7% |
| Arapaho | 100.0 /100 | #17 | Exceptional 4.7% |
| Immigrants | South Central Asia | 100.0 /100 | #18 | Exceptional 4.7% |
| Immigrants | Uzbekistan | 100.0 /100 | #19 | Exceptional 4.8% |
| Burmese | 100.0 /100 | #20 | Exceptional 4.8% |
| Yup'ik | 100.0 /100 | #21 | Exceptional 4.8% |
| Asians | 100.0 /100 | #22 | Exceptional 4.8% |
| Immigrants | Bolivia | 100.0 /100 | #23 | Exceptional 4.8% |
| Immigrants | Lebanon | 100.0 /100 | #24 | Exceptional 4.8% |
| Immigrants | Asia | 100.0 /100 | #25 | Exceptional 4.8% |
| Bhutanese | 100.0 /100 | #26 | Exceptional 4.9% |