Immigrants from Western Africa vs Sudanese Hearing Disability
COMPARE
Immigrants from Western Africa
Sudanese
Hearing Disability
Hearing Disability Comparison
Immigrants from Western Africa
Sudanese
2.6%
HEARING DISABILITY
99.6/ 100
METRIC RATING
37th/ 347
METRIC RANK
2.9%
HEARING DISABILITY
72.1/ 100
METRIC RATING
153rd/ 347
METRIC RANK
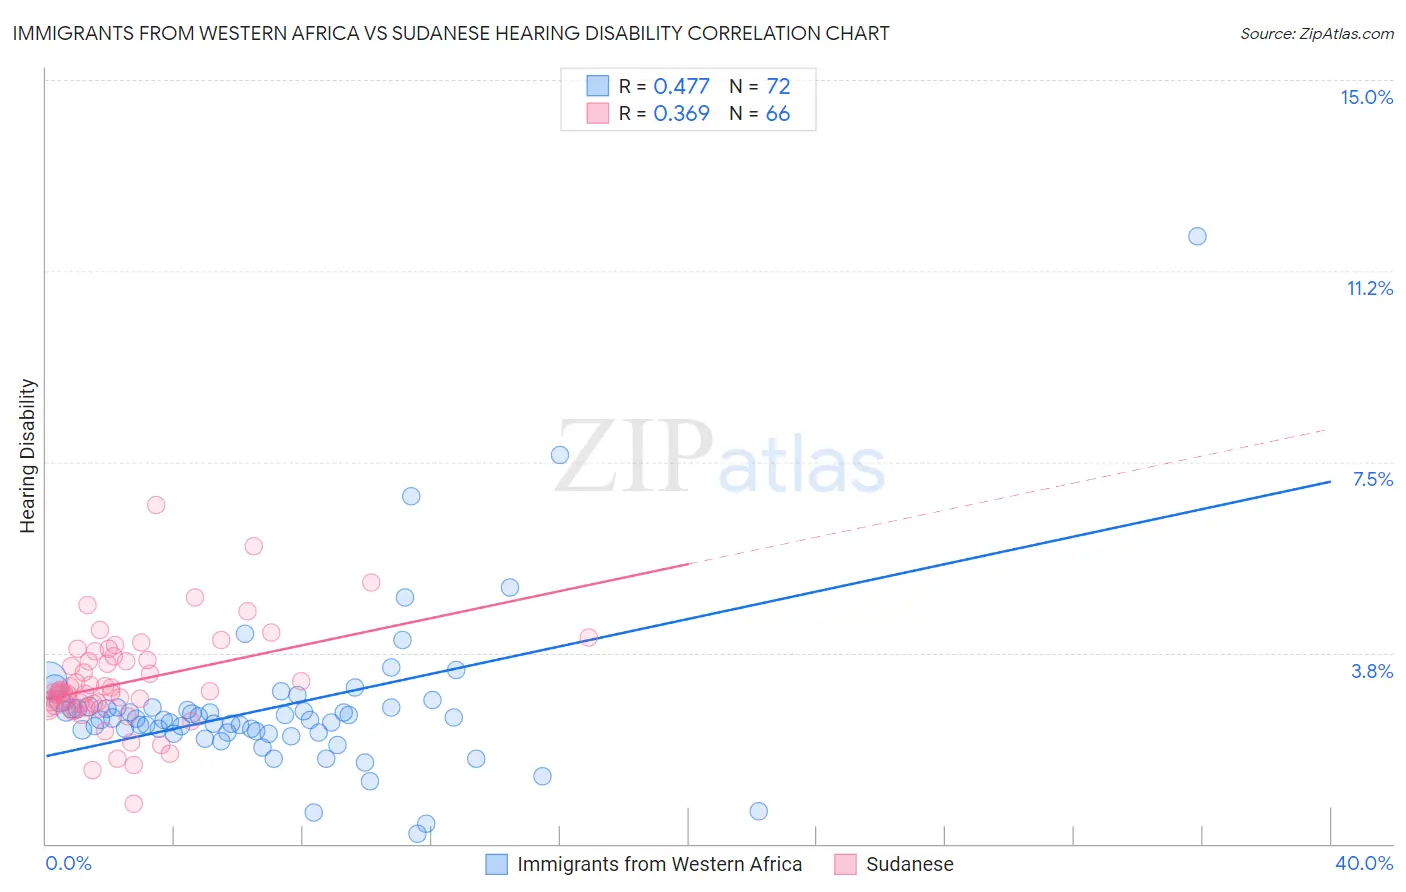
Immigrants from Western Africa vs Sudanese Hearing Disability Correlation Chart
The statistical analysis conducted on geographies consisting of 357,657,073 people shows a moderate positive correlation between the proportion of Immigrants from Western Africa and percentage of population with hearing disability in the United States with a correlation coefficient (R) of 0.477 and weighted average of 2.6%. Similarly, the statistical analysis conducted on geographies consisting of 110,125,850 people shows a mild positive correlation between the proportion of Sudanese and percentage of population with hearing disability in the United States with a correlation coefficient (R) of 0.369 and weighted average of 2.9%, a difference of 12.0%.
Hearing Disability Correlation Summary
| Measurement | Immigrants from Western Africa | Sudanese |
| Minimum | 0.19% | 0.77% |
| Maximum | 11.9% | 6.7% |
| Range | 11.7% | 5.9% |
| Mean | 2.7% | 3.2% |
| Median | 2.4% | 3.0% |
| Interquartile 25% (IQ1) | 2.2% | 2.7% |
| Interquartile 75% (IQ3) | 2.7% | 3.6% |
| Interquartile Range (IQR) | 0.50% | 0.92% |
| Standard Deviation (Sample) | 1.6% | 0.97% |
| Standard Deviation (Population) | 1.6% | 0.96% |
Similar Demographics by Hearing Disability
Demographics Similar to Immigrants from Western Africa by Hearing Disability
In terms of hearing disability, the demographic groups most similar to Immigrants from Western Africa are Okinawan (2.6%, a difference of 0.020%), Immigrants from Jamaica (2.6%, a difference of 0.080%), Salvadoran (2.6%, a difference of 0.25%), Immigrants from China (2.6%, a difference of 0.32%), and Immigrants from Pakistan (2.6%, a difference of 0.37%).
| Demographics | Rating | Rank | Hearing Disability |
| Immigrants | Caribbean | 99.7 /100 | #30 | Exceptional 2.6% |
| Immigrants | Cameroon | 99.7 /100 | #31 | Exceptional 2.6% |
| Immigrants | Venezuela | 99.7 /100 | #32 | Exceptional 2.6% |
| Filipinos | 99.6 /100 | #33 | Exceptional 2.6% |
| Immigrants | Pakistan | 99.6 /100 | #34 | Exceptional 2.6% |
| Salvadorans | 99.6 /100 | #35 | Exceptional 2.6% |
| Okinawans | 99.6 /100 | #36 | Exceptional 2.6% |
| Immigrants | Western Africa | 99.6 /100 | #37 | Exceptional 2.6% |
| Immigrants | Jamaica | 99.5 /100 | #38 | Exceptional 2.6% |
| Immigrants | China | 99.5 /100 | #39 | Exceptional 2.6% |
| Haitians | 99.5 /100 | #40 | Exceptional 2.6% |
| Immigrants | Taiwan | 99.4 /100 | #41 | Exceptional 2.6% |
| West Indians | 99.4 /100 | #42 | Exceptional 2.6% |
| Senegalese | 99.4 /100 | #43 | Exceptional 2.6% |
| Nigerians | 99.4 /100 | #44 | Exceptional 2.6% |
Demographics Similar to Sudanese by Hearing Disability
In terms of hearing disability, the demographic groups most similar to Sudanese are Immigrants from Lebanon (2.9%, a difference of 0.070%), Costa Rican (2.9%, a difference of 0.090%), Immigrants from Lithuania (2.9%, a difference of 0.11%), Immigrants from France (2.9%, a difference of 0.12%), and Palestinian (2.9%, a difference of 0.18%).
| Demographics | Rating | Rank | Hearing Disability |
| Brazilians | 78.7 /100 | #146 | Good 2.9% |
| Tongans | 78.6 /100 | #147 | Good 2.9% |
| Immigrants | Russia | 77.7 /100 | #148 | Good 2.9% |
| Immigrants | Panama | 76.9 /100 | #149 | Good 2.9% |
| Palestinians | 73.6 /100 | #150 | Good 2.9% |
| Immigrants | France | 73.1 /100 | #151 | Good 2.9% |
| Immigrants | Lithuania | 73.0 /100 | #152 | Good 2.9% |
| Sudanese | 72.1 /100 | #153 | Good 2.9% |
| Immigrants | Lebanon | 71.5 /100 | #154 | Good 2.9% |
| Costa Ricans | 71.4 /100 | #155 | Good 2.9% |
| Immigrants | Poland | 70.2 /100 | #156 | Good 2.9% |
| Immigrants | Kazakhstan | 69.6 /100 | #157 | Good 2.9% |
| Immigrants | Burma/Myanmar | 69.5 /100 | #158 | Good 2.9% |
| Immigrants | Australia | 67.4 /100 | #159 | Good 2.9% |
| Immigrants | Fiji | 67.1 /100 | #160 | Good 2.9% |