Immigrants from Western Africa vs Immigrants from Eastern Asia Hearing Disability
COMPARE
Immigrants from Western Africa
Immigrants from Eastern Asia
Hearing Disability
Hearing Disability Comparison
Immigrants from Western Africa
Immigrants from Eastern Asia
2.6%
HEARING DISABILITY
99.6/ 100
METRIC RATING
37th/ 347
METRIC RANK
2.7%
HEARING DISABILITY
99.0/ 100
METRIC RATING
53rd/ 347
METRIC RANK
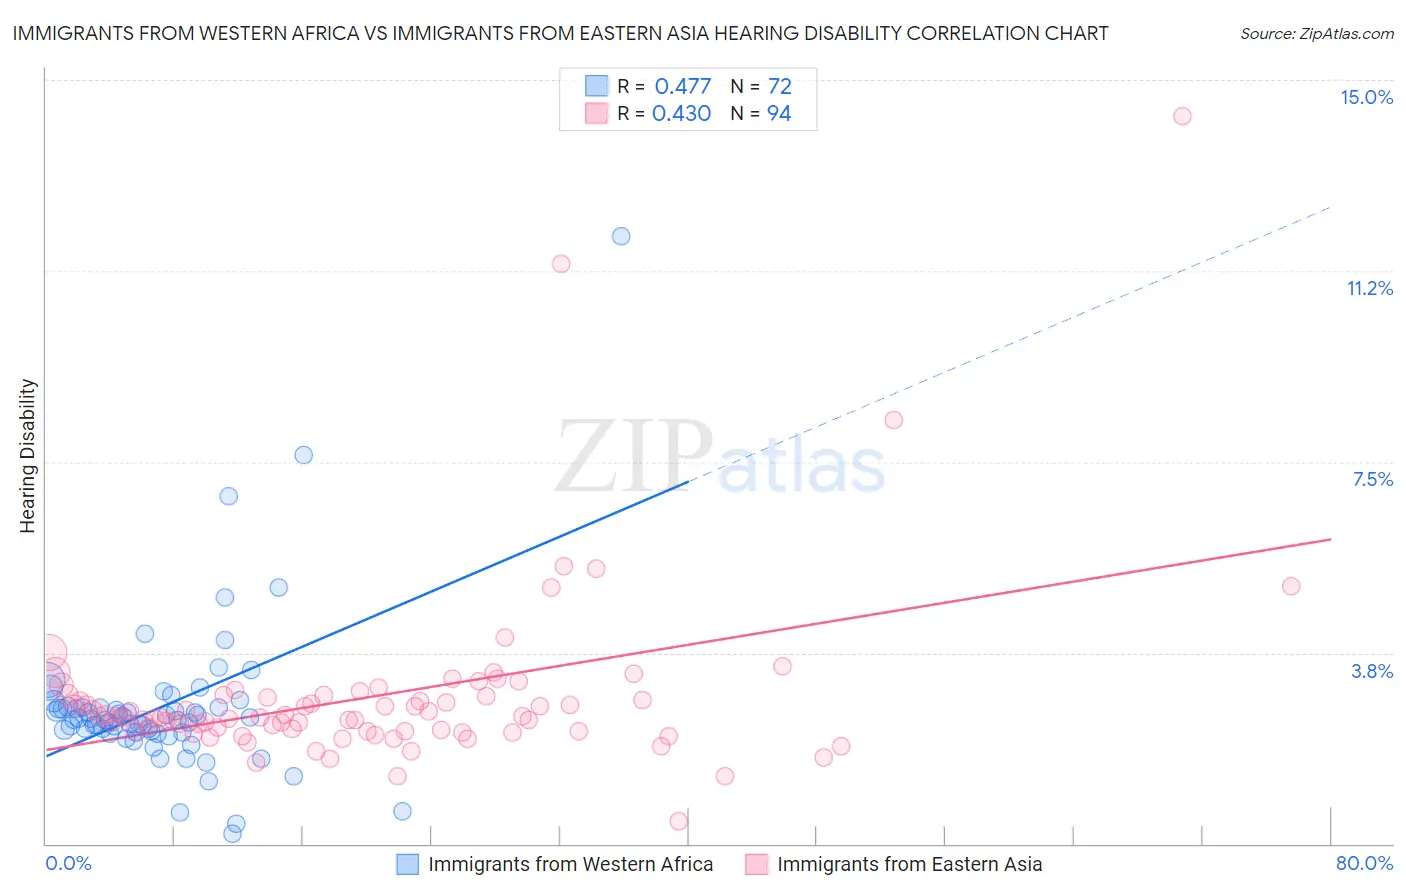
Immigrants from Western Africa vs Immigrants from Eastern Asia Hearing Disability Correlation Chart
The statistical analysis conducted on geographies consisting of 357,657,073 people shows a moderate positive correlation between the proportion of Immigrants from Western Africa and percentage of population with hearing disability in the United States with a correlation coefficient (R) of 0.477 and weighted average of 2.6%. Similarly, the statistical analysis conducted on geographies consisting of 499,587,634 people shows a moderate positive correlation between the proportion of Immigrants from Eastern Asia and percentage of population with hearing disability in the United States with a correlation coefficient (R) of 0.430 and weighted average of 2.7%, a difference of 2.1%.
Hearing Disability Correlation Summary
| Measurement | Immigrants from Western Africa | Immigrants from Eastern Asia |
| Minimum | 0.19% | 0.45% |
| Maximum | 11.9% | 14.3% |
| Range | 11.7% | 13.8% |
| Mean | 2.7% | 2.9% |
| Median | 2.4% | 2.5% |
| Interquartile 25% (IQ1) | 2.2% | 2.2% |
| Interquartile 75% (IQ3) | 2.7% | 2.9% |
| Interquartile Range (IQR) | 0.50% | 0.71% |
| Standard Deviation (Sample) | 1.6% | 1.8% |
| Standard Deviation (Population) | 1.6% | 1.8% |
Demographics Similar to Immigrants from Western Africa and Immigrants from Eastern Asia by Hearing Disability
In terms of hearing disability, the demographic groups most similar to Immigrants from Western Africa are Okinawan (2.6%, a difference of 0.020%), Immigrants from Jamaica (2.6%, a difference of 0.080%), Salvadoran (2.6%, a difference of 0.25%), Immigrants from China (2.6%, a difference of 0.32%), and Haitian (2.6%, a difference of 0.41%). Similarly, the demographic groups most similar to Immigrants from Eastern Asia are Ethiopian (2.7%, a difference of 0.030%), Jamaican (2.7%, a difference of 0.070%), Immigrants from Ethiopia (2.7%, a difference of 0.10%), Immigrants from Hong Kong (2.7%, a difference of 0.42%), and Paraguayan (2.7%, a difference of 0.49%).
| Demographics | Rating | Rank | Hearing Disability |
| Salvadorans | 99.6 /100 | #35 | Exceptional 2.6% |
| Okinawans | 99.6 /100 | #36 | Exceptional 2.6% |
| Immigrants | Western Africa | 99.6 /100 | #37 | Exceptional 2.6% |
| Immigrants | Jamaica | 99.5 /100 | #38 | Exceptional 2.6% |
| Immigrants | China | 99.5 /100 | #39 | Exceptional 2.6% |
| Haitians | 99.5 /100 | #40 | Exceptional 2.6% |
| Immigrants | Taiwan | 99.4 /100 | #41 | Exceptional 2.6% |
| West Indians | 99.4 /100 | #42 | Exceptional 2.6% |
| Senegalese | 99.4 /100 | #43 | Exceptional 2.6% |
| Nigerians | 99.4 /100 | #44 | Exceptional 2.6% |
| Venezuelans | 99.4 /100 | #45 | Exceptional 2.6% |
| Immigrants | Dominica | 99.3 /100 | #46 | Exceptional 2.6% |
| Immigrants | Israel | 99.3 /100 | #47 | Exceptional 2.6% |
| Immigrants | Singapore | 99.3 /100 | #48 | Exceptional 2.6% |
| Immigrants | South America | 99.2 /100 | #49 | Exceptional 2.7% |
| Paraguayans | 99.2 /100 | #50 | Exceptional 2.7% |
| Immigrants | Hong Kong | 99.2 /100 | #51 | Exceptional 2.7% |
| Jamaicans | 99.0 /100 | #52 | Exceptional 2.7% |
| Immigrants | Eastern Asia | 99.0 /100 | #53 | Exceptional 2.7% |
| Ethiopians | 99.0 /100 | #54 | Exceptional 2.7% |
| Immigrants | Ethiopia | 99.0 /100 | #55 | Exceptional 2.7% |