Immigrants from Romania vs Sudanese Hearing Disability
COMPARE
Immigrants from Romania
Sudanese
Hearing Disability
Hearing Disability Comparison
Immigrants from Romania
Sudanese
3.0%
HEARING DISABILITY
48.4/ 100
METRIC RATING
175th/ 347
METRIC RANK
2.9%
HEARING DISABILITY
72.1/ 100
METRIC RATING
153rd/ 347
METRIC RANK
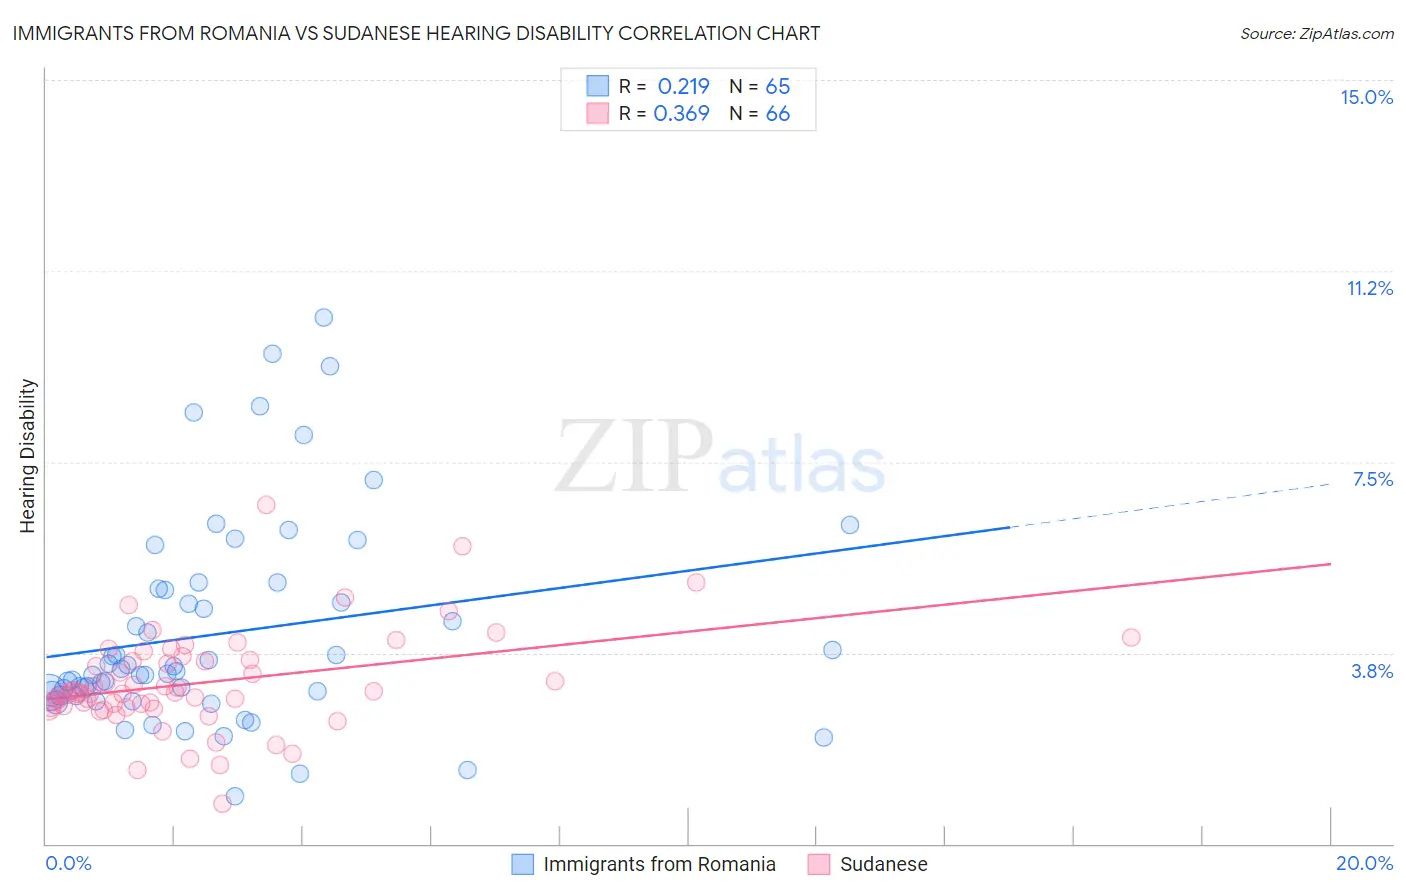
Immigrants from Romania vs Sudanese Hearing Disability Correlation Chart
The statistical analysis conducted on geographies consisting of 256,976,190 people shows a weak positive correlation between the proportion of Immigrants from Romania and percentage of population with hearing disability in the United States with a correlation coefficient (R) of 0.219 and weighted average of 3.0%. Similarly, the statistical analysis conducted on geographies consisting of 110,125,850 people shows a mild positive correlation between the proportion of Sudanese and percentage of population with hearing disability in the United States with a correlation coefficient (R) of 0.369 and weighted average of 2.9%, a difference of 2.4%.
Hearing Disability Correlation Summary
| Measurement | Immigrants from Romania | Sudanese |
| Minimum | 0.93% | 0.77% |
| Maximum | 10.3% | 6.7% |
| Range | 9.4% | 5.9% |
| Mean | 4.1% | 3.2% |
| Median | 3.4% | 3.0% |
| Interquartile 25% (IQ1) | 2.9% | 2.7% |
| Interquartile 75% (IQ3) | 5.0% | 3.6% |
| Interquartile Range (IQR) | 2.1% | 0.92% |
| Standard Deviation (Sample) | 2.0% | 0.97% |
| Standard Deviation (Population) | 2.0% | 0.96% |
Similar Demographics by Hearing Disability
Demographics Similar to Immigrants from Romania by Hearing Disability
In terms of hearing disability, the demographic groups most similar to Immigrants from Romania are Panamanian (3.0%, a difference of 0.14%), Indonesian (3.0%, a difference of 0.15%), Immigrants from Philippines (3.0%, a difference of 0.20%), Japanese (3.0%, a difference of 0.23%), and Immigrants from Serbia (3.0%, a difference of 0.25%).
| Demographics | Rating | Rank | Hearing Disability |
| Immigrants | Greece | 57.9 /100 | #168 | Average 3.0% |
| Arabs | 57.6 /100 | #169 | Average 3.0% |
| Immigrants | Cabo Verde | 56.9 /100 | #170 | Average 3.0% |
| Immigrants | Ukraine | 56.6 /100 | #171 | Average 3.0% |
| Armenians | 56.0 /100 | #172 | Average 3.0% |
| Immigrants | Serbia | 51.1 /100 | #173 | Average 3.0% |
| Indonesians | 50.0 /100 | #174 | Average 3.0% |
| Immigrants | Romania | 48.4 /100 | #175 | Average 3.0% |
| Panamanians | 47.0 /100 | #176 | Average 3.0% |
| Immigrants | Philippines | 46.4 /100 | #177 | Average 3.0% |
| Japanese | 46.0 /100 | #178 | Average 3.0% |
| Immigrants | Moldova | 43.1 /100 | #179 | Average 3.0% |
| Immigrants | Sweden | 42.4 /100 | #180 | Average 3.0% |
| Immigrants | Belgium | 41.5 /100 | #181 | Average 3.0% |
| Immigrants | Italy | 41.1 /100 | #182 | Average 3.0% |
Demographics Similar to Sudanese by Hearing Disability
In terms of hearing disability, the demographic groups most similar to Sudanese are Immigrants from Lebanon (2.9%, a difference of 0.070%), Costa Rican (2.9%, a difference of 0.090%), Immigrants from Lithuania (2.9%, a difference of 0.11%), Immigrants from France (2.9%, a difference of 0.12%), and Palestinian (2.9%, a difference of 0.18%).
| Demographics | Rating | Rank | Hearing Disability |
| Brazilians | 78.7 /100 | #146 | Good 2.9% |
| Tongans | 78.6 /100 | #147 | Good 2.9% |
| Immigrants | Russia | 77.7 /100 | #148 | Good 2.9% |
| Immigrants | Panama | 76.9 /100 | #149 | Good 2.9% |
| Palestinians | 73.6 /100 | #150 | Good 2.9% |
| Immigrants | France | 73.1 /100 | #151 | Good 2.9% |
| Immigrants | Lithuania | 73.0 /100 | #152 | Good 2.9% |
| Sudanese | 72.1 /100 | #153 | Good 2.9% |
| Immigrants | Lebanon | 71.5 /100 | #154 | Good 2.9% |
| Costa Ricans | 71.4 /100 | #155 | Good 2.9% |
| Immigrants | Poland | 70.2 /100 | #156 | Good 2.9% |
| Immigrants | Kazakhstan | 69.6 /100 | #157 | Good 2.9% |
| Immigrants | Burma/Myanmar | 69.5 /100 | #158 | Good 2.9% |
| Immigrants | Australia | 67.4 /100 | #159 | Good 2.9% |
| Immigrants | Fiji | 67.1 /100 | #160 | Good 2.9% |