Inupiat vs Sudanese Hearing Disability
COMPARE
Inupiat
Sudanese
Hearing Disability
Hearing Disability Comparison
Inupiat
Sudanese
4.7%
HEARING DISABILITY
0.0/ 100
METRIC RATING
343rd/ 347
METRIC RANK
2.9%
HEARING DISABILITY
72.1/ 100
METRIC RATING
153rd/ 347
METRIC RANK
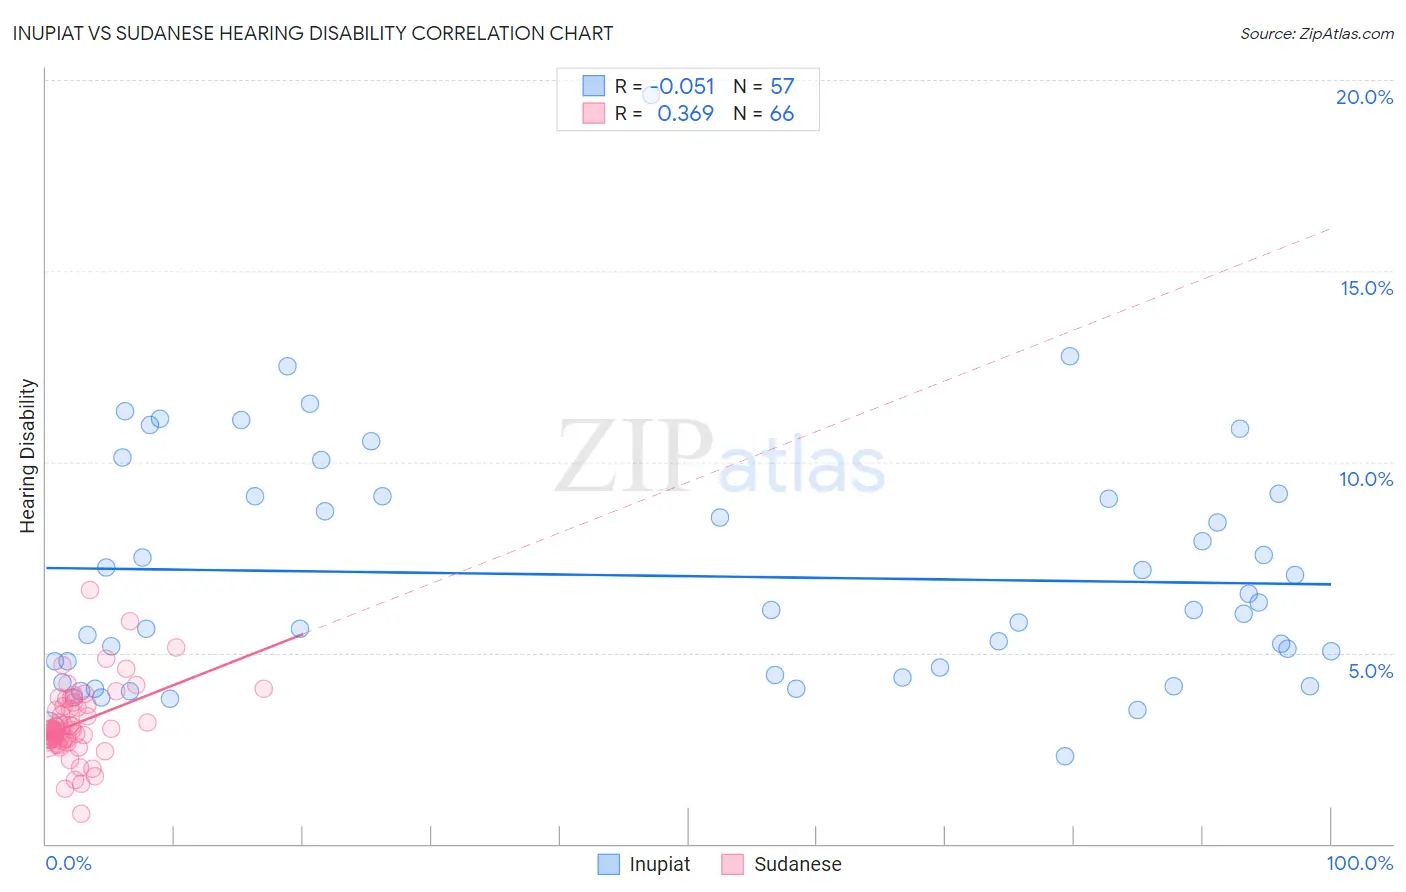
Inupiat vs Sudanese Hearing Disability Correlation Chart
The statistical analysis conducted on geographies consisting of 96,332,419 people shows a slight negative correlation between the proportion of Inupiat and percentage of population with hearing disability in the United States with a correlation coefficient (R) of -0.051 and weighted average of 4.7%. Similarly, the statistical analysis conducted on geographies consisting of 110,125,850 people shows a mild positive correlation between the proportion of Sudanese and percentage of population with hearing disability in the United States with a correlation coefficient (R) of 0.369 and weighted average of 2.9%, a difference of 61.0%.
Hearing Disability Correlation Summary
| Measurement | Inupiat | Sudanese |
| Minimum | 2.3% | 0.77% |
| Maximum | 19.6% | 6.7% |
| Range | 17.3% | 5.9% |
| Mean | 7.0% | 3.2% |
| Median | 6.1% | 3.0% |
| Interquartile 25% (IQ1) | 4.4% | 2.7% |
| Interquartile 75% (IQ3) | 9.1% | 3.6% |
| Interquartile Range (IQR) | 4.7% | 0.92% |
| Standard Deviation (Sample) | 3.2% | 0.97% |
| Standard Deviation (Population) | 3.2% | 0.96% |
Similar Demographics by Hearing Disability
Demographics Similar to Inupiat by Hearing Disability
In terms of hearing disability, the demographic groups most similar to Inupiat are Tsimshian (4.7%, a difference of 0.21%), Navajo (4.6%, a difference of 1.8%), Pueblo (4.6%, a difference of 2.1%), Tlingit-Haida (4.8%, a difference of 2.7%), and Choctaw (4.5%, a difference of 3.6%).
| Demographics | Rating | Rank | Hearing Disability |
| Dutch West Indians | 0.0 /100 | #333 | Tragic 4.3% |
| Aleuts | 0.0 /100 | #334 | Tragic 4.3% |
| Kiowa | 0.0 /100 | #335 | Tragic 4.3% |
| Creek | 0.0 /100 | #336 | Tragic 4.4% |
| Chickasaw | 0.0 /100 | #337 | Tragic 4.5% |
| Alaska Natives | 0.0 /100 | #338 | Tragic 4.5% |
| Choctaw | 0.0 /100 | #339 | Tragic 4.5% |
| Pueblo | 0.0 /100 | #340 | Tragic 4.6% |
| Navajo | 0.0 /100 | #341 | Tragic 4.6% |
| Tsimshian | 0.0 /100 | #342 | Tragic 4.7% |
| Inupiat | 0.0 /100 | #343 | Tragic 4.7% |
| Tlingit-Haida | 0.0 /100 | #344 | Tragic 4.8% |
| Alaskan Athabascans | 0.0 /100 | #345 | Tragic 5.3% |
| Colville | 0.0 /100 | #346 | Tragic 5.3% |
| Yup'ik | 0.0 /100 | #347 | Tragic 5.8% |
Demographics Similar to Sudanese by Hearing Disability
In terms of hearing disability, the demographic groups most similar to Sudanese are Immigrants from Lebanon (2.9%, a difference of 0.070%), Costa Rican (2.9%, a difference of 0.090%), Immigrants from Lithuania (2.9%, a difference of 0.11%), Immigrants from France (2.9%, a difference of 0.12%), and Palestinian (2.9%, a difference of 0.18%).
| Demographics | Rating | Rank | Hearing Disability |
| Brazilians | 78.7 /100 | #146 | Good 2.9% |
| Tongans | 78.6 /100 | #147 | Good 2.9% |
| Immigrants | Russia | 77.7 /100 | #148 | Good 2.9% |
| Immigrants | Panama | 76.9 /100 | #149 | Good 2.9% |
| Palestinians | 73.6 /100 | #150 | Good 2.9% |
| Immigrants | France | 73.1 /100 | #151 | Good 2.9% |
| Immigrants | Lithuania | 73.0 /100 | #152 | Good 2.9% |
| Sudanese | 72.1 /100 | #153 | Good 2.9% |
| Immigrants | Lebanon | 71.5 /100 | #154 | Good 2.9% |
| Costa Ricans | 71.4 /100 | #155 | Good 2.9% |
| Immigrants | Poland | 70.2 /100 | #156 | Good 2.9% |
| Immigrants | Kazakhstan | 69.6 /100 | #157 | Good 2.9% |
| Immigrants | Burma/Myanmar | 69.5 /100 | #158 | Good 2.9% |
| Immigrants | Australia | 67.4 /100 | #159 | Good 2.9% |
| Immigrants | Fiji | 67.1 /100 | #160 | Good 2.9% |