Immigrants from Western Africa vs Puget Sound Salish Hearing Disability
COMPARE
Immigrants from Western Africa
Puget Sound Salish
Hearing Disability
Hearing Disability Comparison
Immigrants from Western Africa
Puget Sound Salish
2.6%
HEARING DISABILITY
99.6/ 100
METRIC RATING
37th/ 347
METRIC RANK
3.9%
HEARING DISABILITY
0.0/ 100
METRIC RATING
315th/ 347
METRIC RANK
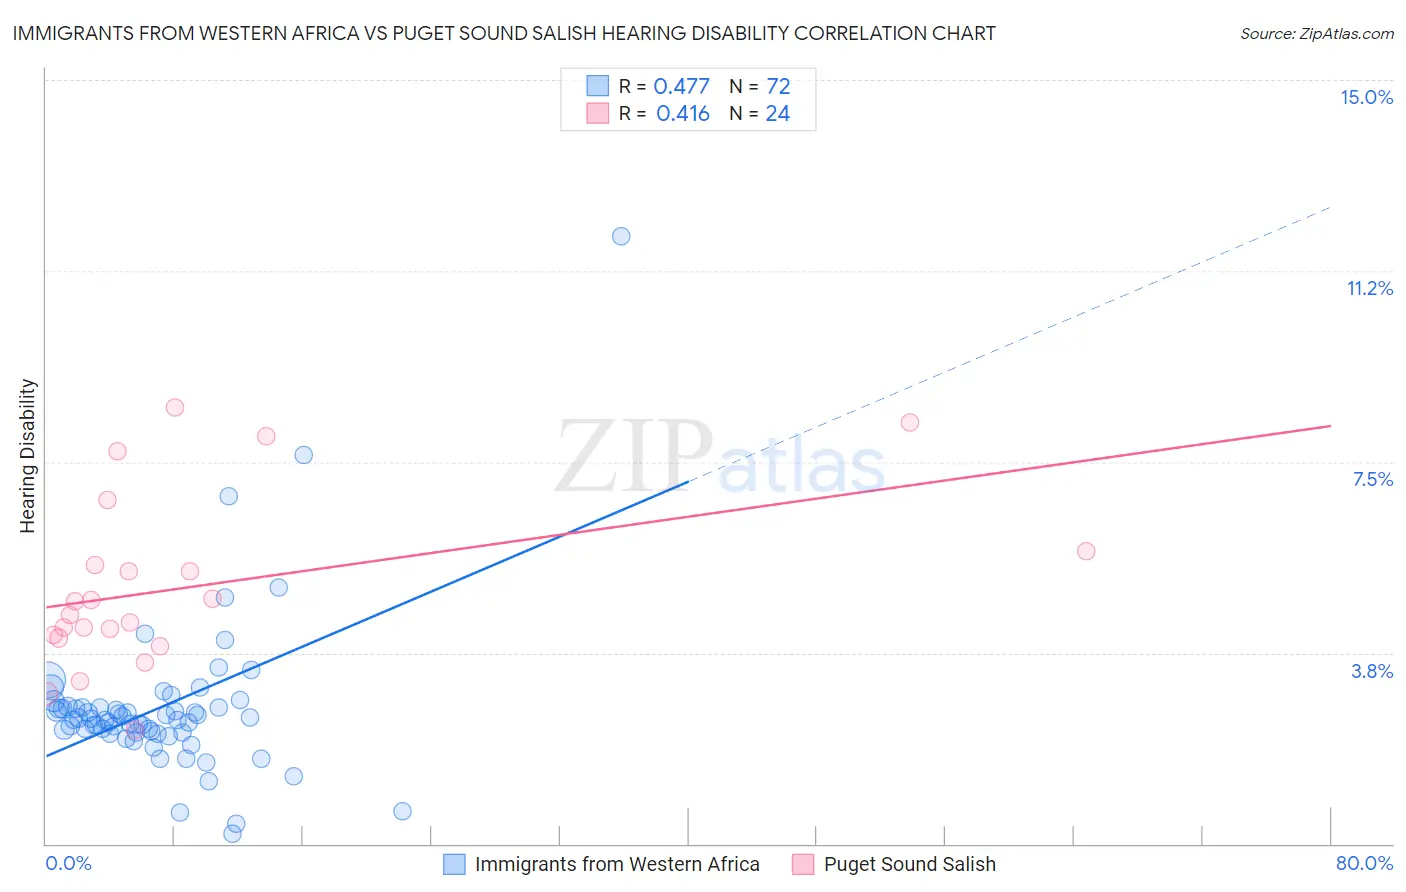
Immigrants from Western Africa vs Puget Sound Salish Hearing Disability Correlation Chart
The statistical analysis conducted on geographies consisting of 357,657,073 people shows a moderate positive correlation between the proportion of Immigrants from Western Africa and percentage of population with hearing disability in the United States with a correlation coefficient (R) of 0.477 and weighted average of 2.6%. Similarly, the statistical analysis conducted on geographies consisting of 46,152,047 people shows a moderate positive correlation between the proportion of Puget Sound Salish and percentage of population with hearing disability in the United States with a correlation coefficient (R) of 0.416 and weighted average of 3.9%, a difference of 51.0%.
Hearing Disability Correlation Summary
| Measurement | Immigrants from Western Africa | Puget Sound Salish |
| Minimum | 0.19% | 2.2% |
| Maximum | 11.9% | 8.6% |
| Range | 11.7% | 6.3% |
| Mean | 2.7% | 5.0% |
| Median | 2.4% | 4.6% |
| Interquartile 25% (IQ1) | 2.2% | 4.1% |
| Interquartile 75% (IQ3) | 2.7% | 5.6% |
| Interquartile Range (IQR) | 0.50% | 1.5% |
| Standard Deviation (Sample) | 1.6% | 1.7% |
| Standard Deviation (Population) | 1.6% | 1.7% |
Similar Demographics by Hearing Disability
Demographics Similar to Immigrants from Western Africa by Hearing Disability
In terms of hearing disability, the demographic groups most similar to Immigrants from Western Africa are Okinawan (2.6%, a difference of 0.020%), Immigrants from Jamaica (2.6%, a difference of 0.080%), Salvadoran (2.6%, a difference of 0.25%), Immigrants from China (2.6%, a difference of 0.32%), and Immigrants from Pakistan (2.6%, a difference of 0.37%).
| Demographics | Rating | Rank | Hearing Disability |
| Immigrants | Caribbean | 99.7 /100 | #30 | Exceptional 2.6% |
| Immigrants | Cameroon | 99.7 /100 | #31 | Exceptional 2.6% |
| Immigrants | Venezuela | 99.7 /100 | #32 | Exceptional 2.6% |
| Filipinos | 99.6 /100 | #33 | Exceptional 2.6% |
| Immigrants | Pakistan | 99.6 /100 | #34 | Exceptional 2.6% |
| Salvadorans | 99.6 /100 | #35 | Exceptional 2.6% |
| Okinawans | 99.6 /100 | #36 | Exceptional 2.6% |
| Immigrants | Western Africa | 99.6 /100 | #37 | Exceptional 2.6% |
| Immigrants | Jamaica | 99.5 /100 | #38 | Exceptional 2.6% |
| Immigrants | China | 99.5 /100 | #39 | Exceptional 2.6% |
| Haitians | 99.5 /100 | #40 | Exceptional 2.6% |
| Immigrants | Taiwan | 99.4 /100 | #41 | Exceptional 2.6% |
| West Indians | 99.4 /100 | #42 | Exceptional 2.6% |
| Senegalese | 99.4 /100 | #43 | Exceptional 2.6% |
| Nigerians | 99.4 /100 | #44 | Exceptional 2.6% |
Demographics Similar to Puget Sound Salish by Hearing Disability
In terms of hearing disability, the demographic groups most similar to Puget Sound Salish are Yakama (3.9%, a difference of 0.010%), Hopi (3.9%, a difference of 0.18%), Spanish American (4.0%, a difference of 0.20%), Cajun (3.9%, a difference of 0.29%), and Comanche (4.0%, a difference of 0.33%).
| Demographics | Rating | Rank | Hearing Disability |
| Ottawa | 0.0 /100 | #308 | Tragic 3.8% |
| Scotch-Irish | 0.0 /100 | #309 | Tragic 3.8% |
| Cree | 0.0 /100 | #310 | Tragic 3.8% |
| Americans | 0.0 /100 | #311 | Tragic 3.9% |
| Cajuns | 0.0 /100 | #312 | Tragic 3.9% |
| Hopi | 0.0 /100 | #313 | Tragic 3.9% |
| Yakama | 0.0 /100 | #314 | Tragic 3.9% |
| Puget Sound Salish | 0.0 /100 | #315 | Tragic 3.9% |
| Spanish Americans | 0.0 /100 | #316 | Tragic 4.0% |
| Comanche | 0.0 /100 | #317 | Tragic 4.0% |
| Cheyenne | 0.0 /100 | #318 | Tragic 4.0% |
| Chippewa | 0.0 /100 | #319 | Tragic 4.0% |
| Shoshone | 0.0 /100 | #320 | Tragic 4.0% |
| Paiute | 0.0 /100 | #321 | Tragic 4.1% |
| Seminole | 0.0 /100 | #322 | Tragic 4.1% |