Immigrants from Western Africa vs Sudanese 5th Grade
COMPARE
Immigrants from Western Africa
Sudanese
5th Grade
5th Grade Comparison
Immigrants from Western Africa
Sudanese
96.6%
5TH GRADE
0.1/ 100
METRIC RATING
280th/ 347
METRIC RANK
97.1%
5TH GRADE
7.0/ 100
METRIC RATING
216th/ 347
METRIC RANK
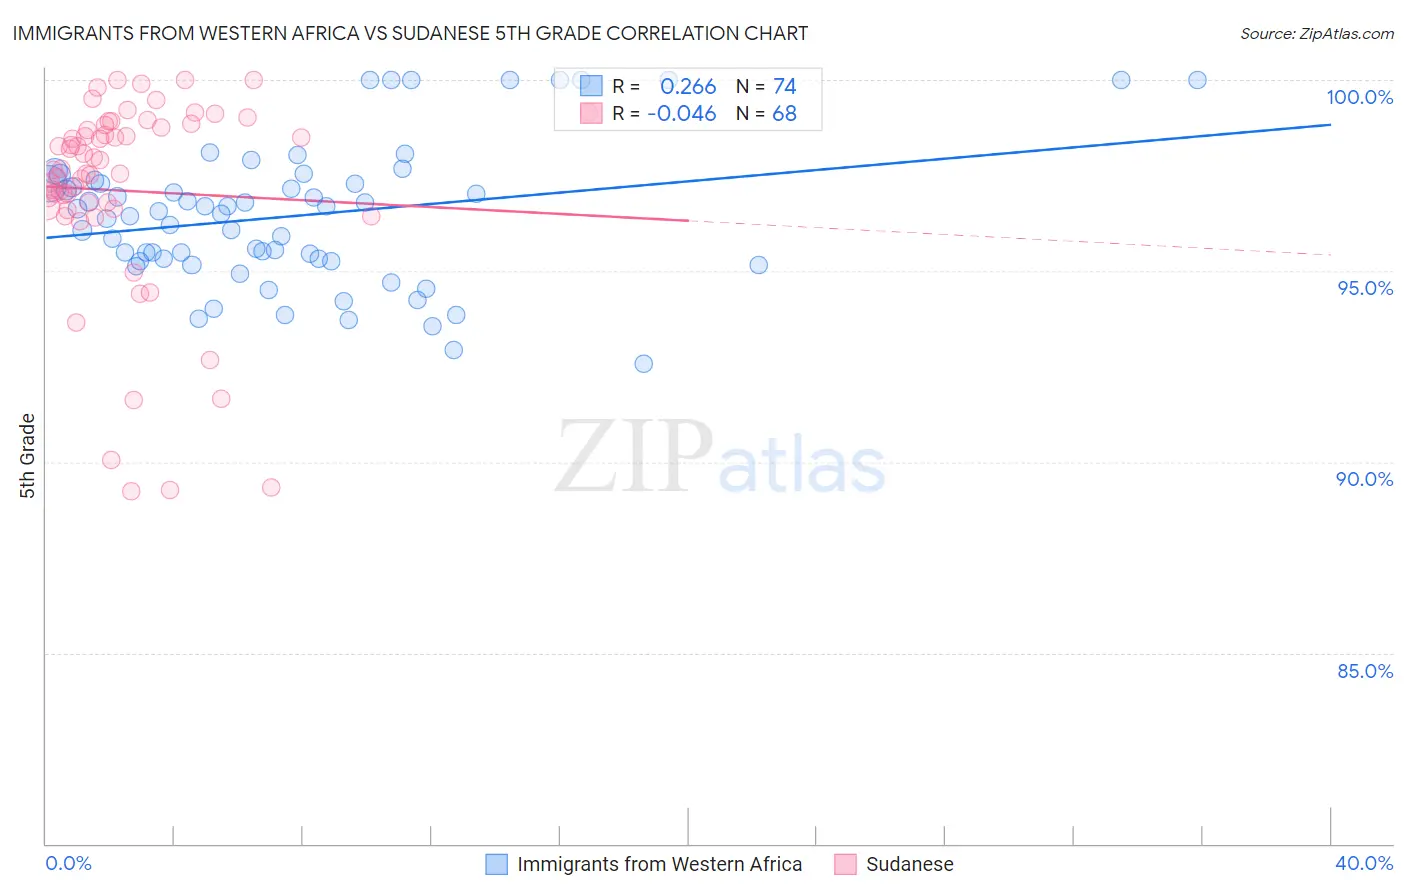
Immigrants from Western Africa vs Sudanese 5th Grade Correlation Chart
The statistical analysis conducted on geographies consisting of 357,809,696 people shows a weak positive correlation between the proportion of Immigrants from Western Africa and percentage of population with at least 5th grade education in the United States with a correlation coefficient (R) of 0.266 and weighted average of 96.6%. Similarly, the statistical analysis conducted on geographies consisting of 110,147,806 people shows no correlation between the proportion of Sudanese and percentage of population with at least 5th grade education in the United States with a correlation coefficient (R) of -0.046 and weighted average of 97.1%, a difference of 0.47%.
5th Grade Correlation Summary
| Measurement | Immigrants from Western Africa | Sudanese |
| Minimum | 92.6% | 89.2% |
| Maximum | 100.0% | 100.0% |
| Range | 7.4% | 10.8% |
| Mean | 96.4% | 97.1% |
| Median | 96.5% | 97.7% |
| Interquartile 25% (IQ1) | 95.3% | 96.6% |
| Interquartile 75% (IQ3) | 97.3% | 98.8% |
| Interquartile Range (IQR) | 2.0% | 2.1% |
| Standard Deviation (Sample) | 1.8% | 2.6% |
| Standard Deviation (Population) | 1.8% | 2.6% |
Similar Demographics by 5th Grade
Demographics Similar to Immigrants from Western Africa by 5th Grade
In terms of 5th grade, the demographic groups most similar to Immigrants from Western Africa are Houma (96.6%, a difference of 0.0%), Barbadian (96.6%, a difference of 0.0%), Fijian (96.6%, a difference of 0.0%), Immigrants from Philippines (96.6%, a difference of 0.010%), and Immigrants from Trinidad and Tobago (96.6%, a difference of 0.010%).
| Demographics | Rating | Rank | 5th Grade |
| Yaqui | 0.1 /100 | #273 | Tragic 96.7% |
| Immigrants | Cameroon | 0.1 /100 | #274 | Tragic 96.7% |
| Immigrants | Peru | 0.1 /100 | #275 | Tragic 96.6% |
| Cubans | 0.1 /100 | #276 | Tragic 96.6% |
| Immigrants | Bolivia | 0.1 /100 | #277 | Tragic 96.6% |
| Immigrants | Ghana | 0.1 /100 | #278 | Tragic 96.6% |
| Immigrants | Philippines | 0.1 /100 | #279 | Tragic 96.6% |
| Immigrants | Western Africa | 0.1 /100 | #280 | Tragic 96.6% |
| Houma | 0.1 /100 | #281 | Tragic 96.6% |
| Barbadians | 0.1 /100 | #282 | Tragic 96.6% |
| Fijians | 0.1 /100 | #283 | Tragic 96.6% |
| Immigrants | Trinidad and Tobago | 0.1 /100 | #284 | Tragic 96.6% |
| Immigrants | St. Vincent and the Grenadines | 0.1 /100 | #285 | Tragic 96.6% |
| Immigrants | Thailand | 0.1 /100 | #286 | Tragic 96.6% |
| Immigrants | Afghanistan | 0.1 /100 | #287 | Tragic 96.6% |
Demographics Similar to Sudanese by 5th Grade
In terms of 5th grade, the demographic groups most similar to Sudanese are Immigrants from Lebanon (97.1%, a difference of 0.0%), Portuguese (97.1%, a difference of 0.010%), Costa Rican (97.1%, a difference of 0.010%), Immigrants from Morocco (97.1%, a difference of 0.010%), and Immigrants from Sudan (97.1%, a difference of 0.010%).
| Demographics | Rating | Rank | 5th Grade |
| Immigrants | Nepal | 10.3 /100 | #209 | Poor 97.1% |
| Immigrants | Oceania | 10.0 /100 | #210 | Poor 97.1% |
| Samoans | 8.5 /100 | #211 | Tragic 97.1% |
| Immigrants | Iraq | 8.3 /100 | #212 | Tragic 97.1% |
| Portuguese | 7.8 /100 | #213 | Tragic 97.1% |
| Costa Ricans | 7.7 /100 | #214 | Tragic 97.1% |
| Immigrants | Morocco | 7.5 /100 | #215 | Tragic 97.1% |
| Sudanese | 7.0 /100 | #216 | Tragic 97.1% |
| Immigrants | Lebanon | 6.8 /100 | #217 | Tragic 97.1% |
| Immigrants | Sudan | 6.5 /100 | #218 | Tragic 97.1% |
| Immigrants | Syria | 6.4 /100 | #219 | Tragic 97.1% |
| Immigrants | Southern Europe | 6.3 /100 | #220 | Tragic 97.1% |
| Sierra Leoneans | 6.0 /100 | #221 | Tragic 97.1% |
| Immigrants | Panama | 5.7 /100 | #222 | Tragic 97.0% |
| Liberians | 5.7 /100 | #223 | Tragic 97.0% |