Immigrants from Uzbekistan vs Pakistani Male Disability
COMPARE
Immigrants from Uzbekistan
Pakistani
Male Disability
Male Disability Comparison
Immigrants from Uzbekistan
Pakistanis
10.4%
MALE DISABILITY
99.6/ 100
METRIC RATING
53rd/ 347
METRIC RANK
11.3%
MALE DISABILITY
30.3/ 100
METRIC RATING
185th/ 347
METRIC RANK
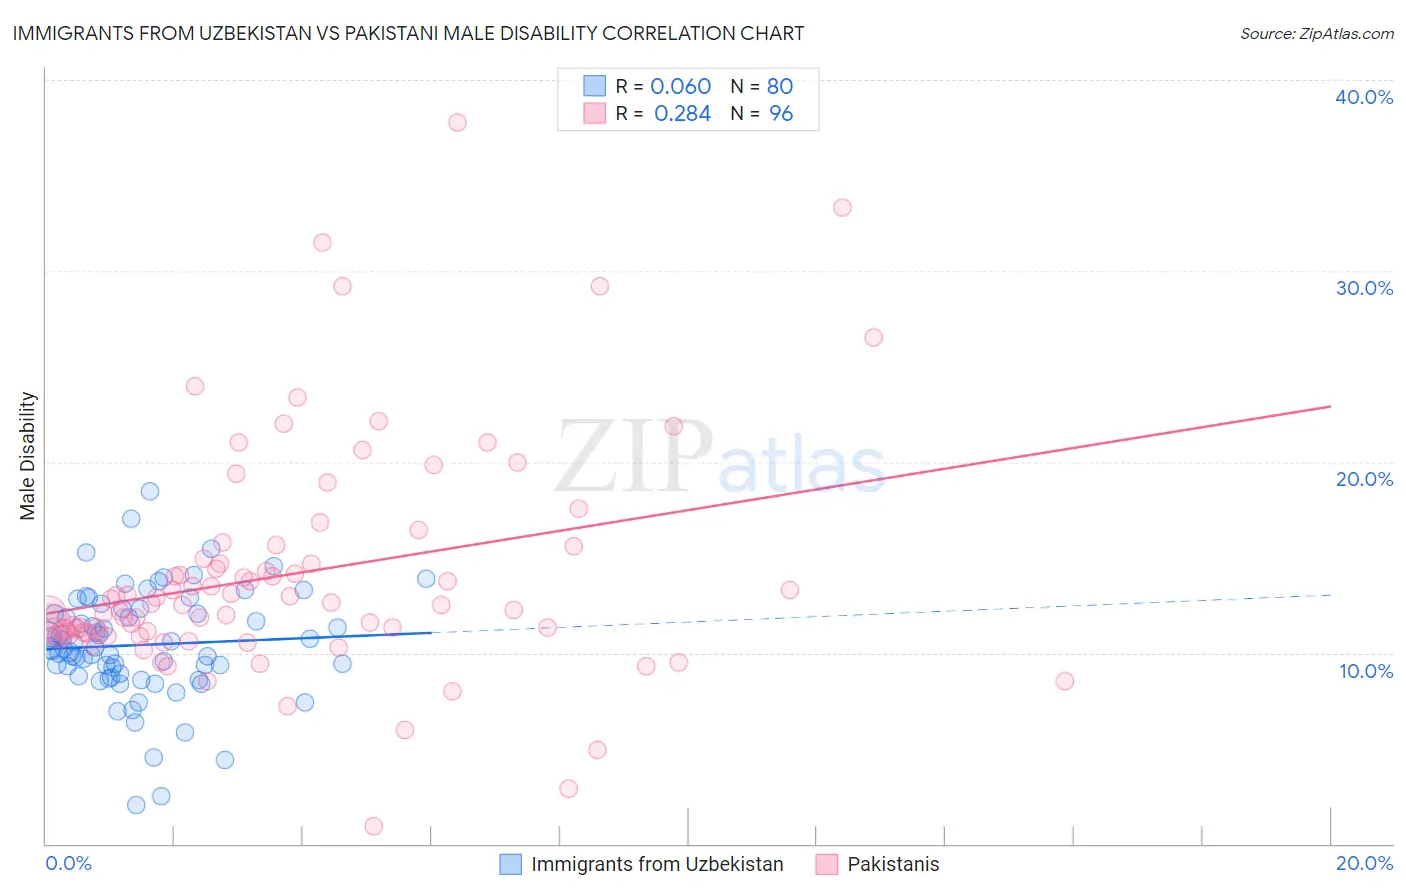
Immigrants from Uzbekistan vs Pakistani Male Disability Correlation Chart
The statistical analysis conducted on geographies consisting of 118,722,579 people shows a slight positive correlation between the proportion of Immigrants from Uzbekistan and percentage of males with a disability in the United States with a correlation coefficient (R) of 0.060 and weighted average of 10.4%. Similarly, the statistical analysis conducted on geographies consisting of 335,283,610 people shows a weak positive correlation between the proportion of Pakistanis and percentage of males with a disability in the United States with a correlation coefficient (R) of 0.284 and weighted average of 11.3%, a difference of 9.5%.
Male Disability Correlation Summary
| Measurement | Immigrants from Uzbekistan | Pakistani |
| Minimum | 2.0% | 0.92% |
| Maximum | 18.4% | 37.8% |
| Range | 16.4% | 36.8% |
| Mean | 10.4% | 14.1% |
| Median | 10.2% | 12.5% |
| Interquartile 25% (IQ1) | 8.8% | 11.0% |
| Interquartile 75% (IQ3) | 12.2% | 15.2% |
| Interquartile Range (IQR) | 3.4% | 4.2% |
| Standard Deviation (Sample) | 2.9% | 6.1% |
| Standard Deviation (Population) | 2.8% | 6.0% |
Similar Demographics by Male Disability
Demographics Similar to Immigrants from Uzbekistan by Male Disability
In terms of male disability, the demographic groups most similar to Immigrants from Uzbekistan are Immigrants from Saudi Arabia (10.4%, a difference of 0.020%), Salvadoran (10.4%, a difference of 0.040%), Peruvian (10.4%, a difference of 0.040%), Immigrants from Eritrea (10.4%, a difference of 0.060%), and Tongan (10.4%, a difference of 0.10%).
| Demographics | Rating | Rank | Male Disability |
| Cambodians | 99.7 /100 | #46 | Exceptional 10.3% |
| Immigrants | Peru | 99.7 /100 | #47 | Exceptional 10.3% |
| Israelis | 99.7 /100 | #48 | Exceptional 10.3% |
| Immigrants | Spain | 99.7 /100 | #49 | Exceptional 10.3% |
| South Americans | 99.6 /100 | #50 | Exceptional 10.3% |
| Salvadorans | 99.6 /100 | #51 | Exceptional 10.4% |
| Immigrants | Saudi Arabia | 99.6 /100 | #52 | Exceptional 10.4% |
| Immigrants | Uzbekistan | 99.6 /100 | #53 | Exceptional 10.4% |
| Peruvians | 99.6 /100 | #54 | Exceptional 10.4% |
| Immigrants | Eritrea | 99.6 /100 | #55 | Exceptional 10.4% |
| Tongans | 99.6 /100 | #56 | Exceptional 10.4% |
| Immigrants | South America | 99.6 /100 | #57 | Exceptional 10.4% |
| Immigrants | Japan | 99.5 /100 | #58 | Exceptional 10.4% |
| Immigrants | Australia | 99.5 /100 | #59 | Exceptional 10.4% |
| Immigrants | Colombia | 99.5 /100 | #60 | Exceptional 10.4% |
Demographics Similar to Pakistanis by Male Disability
In terms of male disability, the demographic groups most similar to Pakistanis are Iraqi (11.3%, a difference of 0.010%), Immigrants from Central America (11.3%, a difference of 0.16%), Immigrants from Zaire (11.4%, a difference of 0.18%), Immigrants from Austria (11.4%, a difference of 0.20%), and Immigrants from Belize (11.3%, a difference of 0.21%).
| Demographics | Rating | Rank | Male Disability |
| Australians | 42.2 /100 | #178 | Average 11.3% |
| Immigrants | Caribbean | 41.4 /100 | #179 | Average 11.3% |
| Hondurans | 41.1 /100 | #180 | Average 11.3% |
| Immigrants | Senegal | 34.4 /100 | #181 | Fair 11.3% |
| Immigrants | Belize | 33.7 /100 | #182 | Fair 11.3% |
| Immigrants | Central America | 32.9 /100 | #183 | Fair 11.3% |
| Iraqis | 30.5 /100 | #184 | Fair 11.3% |
| Pakistanis | 30.3 /100 | #185 | Fair 11.3% |
| Immigrants | Zaire | 27.6 /100 | #186 | Fair 11.4% |
| Immigrants | Austria | 27.3 /100 | #187 | Fair 11.4% |
| Estonians | 26.8 /100 | #188 | Fair 11.4% |
| Immigrants | Netherlands | 25.9 /100 | #189 | Fair 11.4% |
| Immigrants | Bosnia and Herzegovina | 25.4 /100 | #190 | Fair 11.4% |
| Senegalese | 23.2 /100 | #191 | Fair 11.4% |
| Assyrians/Chaldeans/Syriacs | 23.2 /100 | #192 | Fair 11.4% |