Immigrants from Uzbekistan vs Immigrants from Northern Europe Male Disability
COMPARE
Immigrants from Uzbekistan
Immigrants from Northern Europe
Male Disability
Male Disability Comparison
Immigrants from Uzbekistan
Immigrants from Northern Europe
10.4%
MALE DISABILITY
99.6/ 100
METRIC RATING
53rd/ 347
METRIC RANK
11.1%
MALE DISABILITY
73.2/ 100
METRIC RATING
153rd/ 347
METRIC RANK
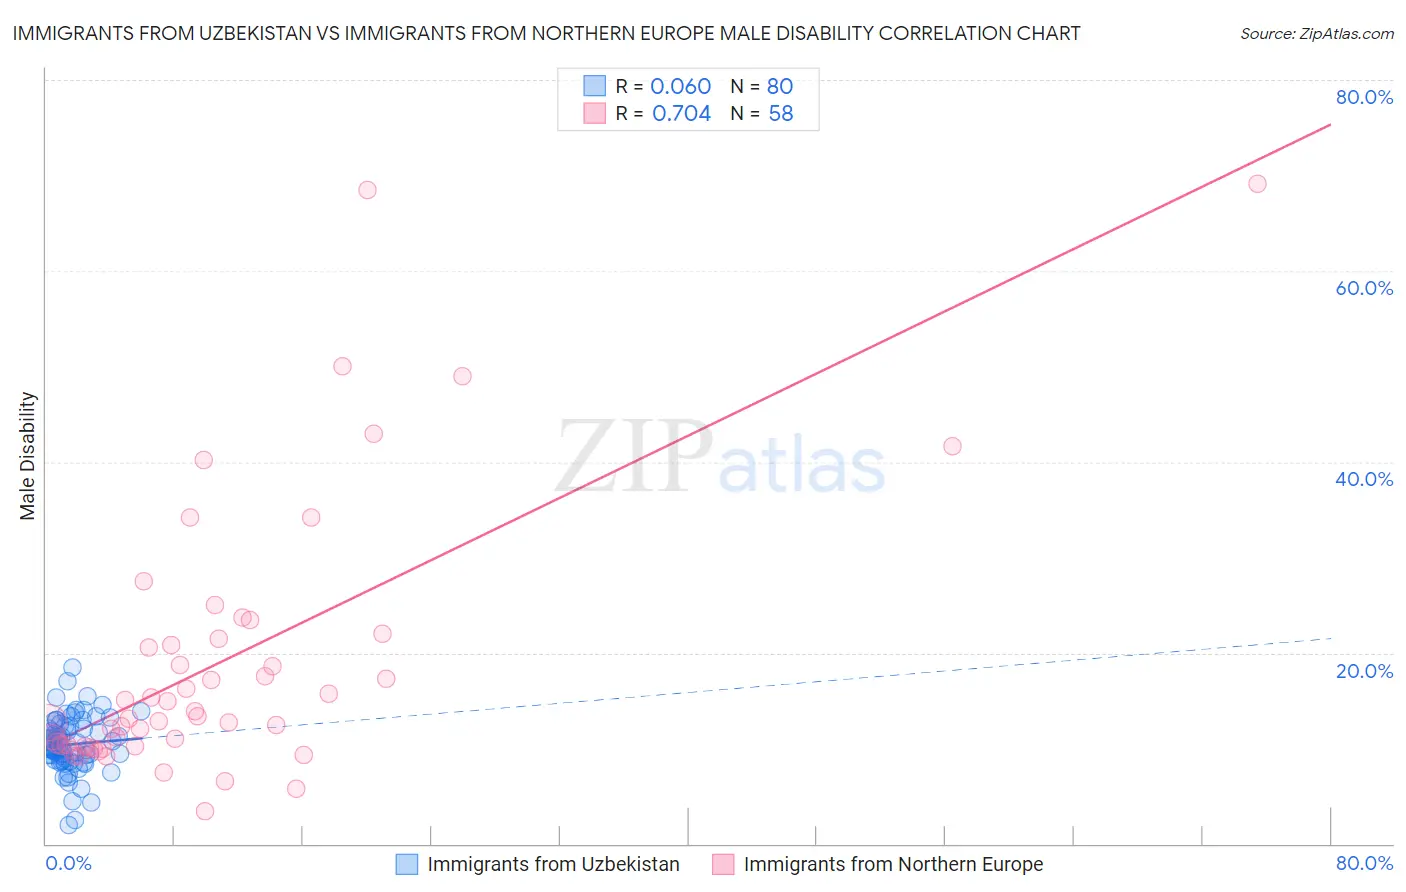
Immigrants from Uzbekistan vs Immigrants from Northern Europe Male Disability Correlation Chart
The statistical analysis conducted on geographies consisting of 118,722,579 people shows a slight positive correlation between the proportion of Immigrants from Uzbekistan and percentage of males with a disability in the United States with a correlation coefficient (R) of 0.060 and weighted average of 10.4%. Similarly, the statistical analysis conducted on geographies consisting of 477,177,667 people shows a strong positive correlation between the proportion of Immigrants from Northern Europe and percentage of males with a disability in the United States with a correlation coefficient (R) of 0.704 and weighted average of 11.1%, a difference of 6.7%.
Male Disability Correlation Summary
| Measurement | Immigrants from Uzbekistan | Immigrants from Northern Europe |
| Minimum | 2.0% | 3.4% |
| Maximum | 18.4% | 69.2% |
| Range | 16.4% | 65.8% |
| Mean | 10.4% | 19.0% |
| Median | 10.2% | 13.3% |
| Interquartile 25% (IQ1) | 8.8% | 10.2% |
| Interquartile 75% (IQ3) | 12.2% | 21.4% |
| Interquartile Range (IQR) | 3.4% | 11.2% |
| Standard Deviation (Sample) | 2.9% | 14.2% |
| Standard Deviation (Population) | 2.8% | 14.1% |
Similar Demographics by Male Disability
Demographics Similar to Immigrants from Uzbekistan by Male Disability
In terms of male disability, the demographic groups most similar to Immigrants from Uzbekistan are Immigrants from Saudi Arabia (10.4%, a difference of 0.020%), Salvadoran (10.4%, a difference of 0.040%), Peruvian (10.4%, a difference of 0.040%), Immigrants from Eritrea (10.4%, a difference of 0.060%), and Tongan (10.4%, a difference of 0.10%).
| Demographics | Rating | Rank | Male Disability |
| Cambodians | 99.7 /100 | #46 | Exceptional 10.3% |
| Immigrants | Peru | 99.7 /100 | #47 | Exceptional 10.3% |
| Israelis | 99.7 /100 | #48 | Exceptional 10.3% |
| Immigrants | Spain | 99.7 /100 | #49 | Exceptional 10.3% |
| South Americans | 99.6 /100 | #50 | Exceptional 10.3% |
| Salvadorans | 99.6 /100 | #51 | Exceptional 10.4% |
| Immigrants | Saudi Arabia | 99.6 /100 | #52 | Exceptional 10.4% |
| Immigrants | Uzbekistan | 99.6 /100 | #53 | Exceptional 10.4% |
| Peruvians | 99.6 /100 | #54 | Exceptional 10.4% |
| Immigrants | Eritrea | 99.6 /100 | #55 | Exceptional 10.4% |
| Tongans | 99.6 /100 | #56 | Exceptional 10.4% |
| Immigrants | South America | 99.6 /100 | #57 | Exceptional 10.4% |
| Immigrants | Japan | 99.5 /100 | #58 | Exceptional 10.4% |
| Immigrants | Australia | 99.5 /100 | #59 | Exceptional 10.4% |
| Immigrants | Colombia | 99.5 /100 | #60 | Exceptional 10.4% |
Demographics Similar to Immigrants from Northern Europe by Male Disability
In terms of male disability, the demographic groups most similar to Immigrants from Northern Europe are Immigrants from Moldova (11.1%, a difference of 0.020%), Immigrants from Albania (11.0%, a difference of 0.090%), Cuban (11.0%, a difference of 0.12%), Immigrants from Guatemala (11.0%, a difference of 0.14%), and Immigrants from Middle Africa (11.1%, a difference of 0.16%).
| Demographics | Rating | Rank | Male Disability |
| Koreans | 77.5 /100 | #146 | Good 11.0% |
| Immigrants | Croatia | 77.3 /100 | #147 | Good 11.0% |
| Sudanese | 77.1 /100 | #148 | Good 11.0% |
| Immigrants | Denmark | 76.4 /100 | #149 | Good 11.0% |
| Immigrants | Guatemala | 75.1 /100 | #150 | Good 11.0% |
| Cubans | 74.9 /100 | #151 | Good 11.0% |
| Immigrants | Albania | 74.4 /100 | #152 | Good 11.0% |
| Immigrants | Northern Europe | 73.2 /100 | #153 | Good 11.1% |
| Immigrants | Moldova | 72.8 /100 | #154 | Good 11.1% |
| Immigrants | Middle Africa | 70.9 /100 | #155 | Good 11.1% |
| Russians | 69.8 /100 | #156 | Good 11.1% |
| Immigrants | Western Africa | 69.2 /100 | #157 | Good 11.1% |
| Latvians | 68.1 /100 | #158 | Good 11.1% |
| Guatemalans | 67.2 /100 | #159 | Good 11.1% |
| Albanians | 66.5 /100 | #160 | Good 11.1% |