Immigrants from Uruguay vs Immigrants from Indonesia Self-Care Disability
COMPARE
Immigrants from Uruguay
Immigrants from Indonesia
Self-Care Disability
Self-Care Disability Comparison
Immigrants from Uruguay
Immigrants from Indonesia
2.4%
SELF-CARE DISABILITY
85.4/ 100
METRIC RATING
140th/ 347
METRIC RANK
2.4%
SELF-CARE DISABILITY
94.3/ 100
METRIC RATING
106th/ 347
METRIC RANK
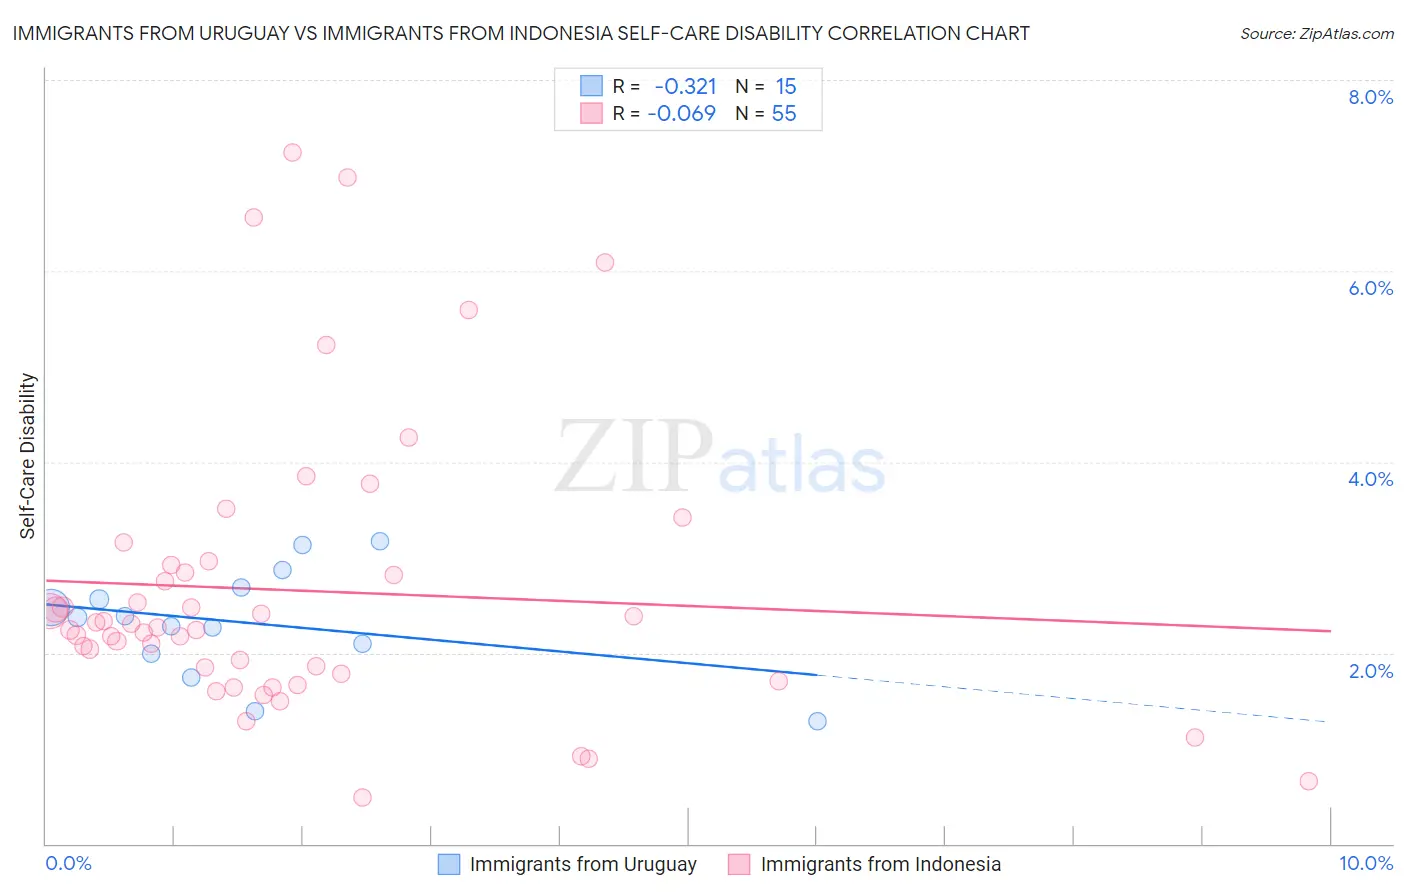
Immigrants from Uruguay vs Immigrants from Indonesia Self-Care Disability Correlation Chart
The statistical analysis conducted on geographies consisting of 133,239,464 people shows a mild negative correlation between the proportion of Immigrants from Uruguay and percentage of population with self-care disability in the United States with a correlation coefficient (R) of -0.321 and weighted average of 2.4%. Similarly, the statistical analysis conducted on geographies consisting of 215,649,762 people shows a slight negative correlation between the proportion of Immigrants from Indonesia and percentage of population with self-care disability in the United States with a correlation coefficient (R) of -0.069 and weighted average of 2.4%, a difference of 1.3%.
Self-Care Disability Correlation Summary
| Measurement | Immigrants from Uruguay | Immigrants from Indonesia |
| Minimum | 1.3% | 0.49% |
| Maximum | 3.2% | 7.2% |
| Range | 1.9% | 6.8% |
| Mean | 2.3% | 2.7% |
| Median | 2.4% | 2.3% |
| Interquartile 25% (IQ1) | 2.0% | 1.8% |
| Interquartile 75% (IQ3) | 2.7% | 2.9% |
| Interquartile Range (IQR) | 0.69% | 1.1% |
| Standard Deviation (Sample) | 0.56% | 1.5% |
| Standard Deviation (Population) | 0.54% | 1.5% |
Similar Demographics by Self-Care Disability
Demographics Similar to Immigrants from Uruguay by Self-Care Disability
In terms of self-care disability, the demographic groups most similar to Immigrants from Uruguay are Alaska Native (2.4%, a difference of 0.090%), Immigrants from Croatia (2.4%, a difference of 0.12%), Sri Lankan (2.4%, a difference of 0.12%), Austrian (2.4%, a difference of 0.17%), and South American Indian (2.4%, a difference of 0.19%).
| Demographics | Rating | Rank | Self-Care Disability |
| Immigrants | Colombia | 88.5 /100 | #133 | Excellent 2.4% |
| Russians | 88.2 /100 | #134 | Excellent 2.4% |
| Laotians | 87.8 /100 | #135 | Excellent 2.4% |
| South American Indians | 87.2 /100 | #136 | Excellent 2.4% |
| Austrians | 87.0 /100 | #137 | Excellent 2.4% |
| Immigrants | Croatia | 86.6 /100 | #138 | Excellent 2.4% |
| Sri Lankans | 86.6 /100 | #139 | Excellent 2.4% |
| Immigrants | Uruguay | 85.4 /100 | #140 | Excellent 2.4% |
| Alaska Natives | 84.5 /100 | #141 | Excellent 2.4% |
| Immigrants | Peru | 83.2 /100 | #142 | Excellent 2.4% |
| Afghans | 82.3 /100 | #143 | Excellent 2.4% |
| Costa Ricans | 80.8 /100 | #144 | Excellent 2.4% |
| Germans | 80.1 /100 | #145 | Excellent 2.4% |
| Israelis | 80.0 /100 | #146 | Good 2.4% |
| Dutch | 77.5 /100 | #147 | Good 2.4% |
Demographics Similar to Immigrants from Indonesia by Self-Care Disability
In terms of self-care disability, the demographic groups most similar to Immigrants from Indonesia are Carpatho Rusyn (2.4%, a difference of 0.010%), British (2.4%, a difference of 0.010%), Bhutanese (2.4%, a difference of 0.040%), Greek (2.4%, a difference of 0.040%), and Slovene (2.4%, a difference of 0.050%).
| Demographics | Rating | Rank | Self-Care Disability |
| Immigrants | Israel | 96.1 /100 | #99 | Exceptional 2.4% |
| Europeans | 95.8 /100 | #100 | Exceptional 2.4% |
| Immigrants | Scotland | 95.7 /100 | #101 | Exceptional 2.4% |
| Croatians | 95.0 /100 | #102 | Exceptional 2.4% |
| Alsatians | 94.9 /100 | #103 | Exceptional 2.4% |
| Bhutanese | 94.5 /100 | #104 | Exceptional 2.4% |
| Carpatho Rusyns | 94.4 /100 | #105 | Exceptional 2.4% |
| Immigrants | Indonesia | 94.3 /100 | #106 | Exceptional 2.4% |
| British | 94.3 /100 | #107 | Exceptional 2.4% |
| Greeks | 94.1 /100 | #108 | Exceptional 2.4% |
| Slovenes | 94.1 /100 | #109 | Exceptional 2.4% |
| Immigrants | Africa | 93.7 /100 | #110 | Exceptional 2.4% |
| Serbians | 93.6 /100 | #111 | Exceptional 2.4% |
| Scandinavians | 93.5 /100 | #112 | Exceptional 2.4% |
| South Americans | 93.2 /100 | #113 | Exceptional 2.4% |