Fijian vs Inupiat Disability Age Under 5
COMPARE
Fijian
Inupiat
Disability Age Under 5
Disability Age Under 5 Comparison
Fijians
Inupiat
1.2%
DISABILITY AGE UNDER 5
84.7/ 100
METRIC RATING
135th/ 347
METRIC RANK
3.7%
DISABILITY AGE UNDER 5
0.0/ 100
METRIC RATING
344th/ 347
METRIC RANK
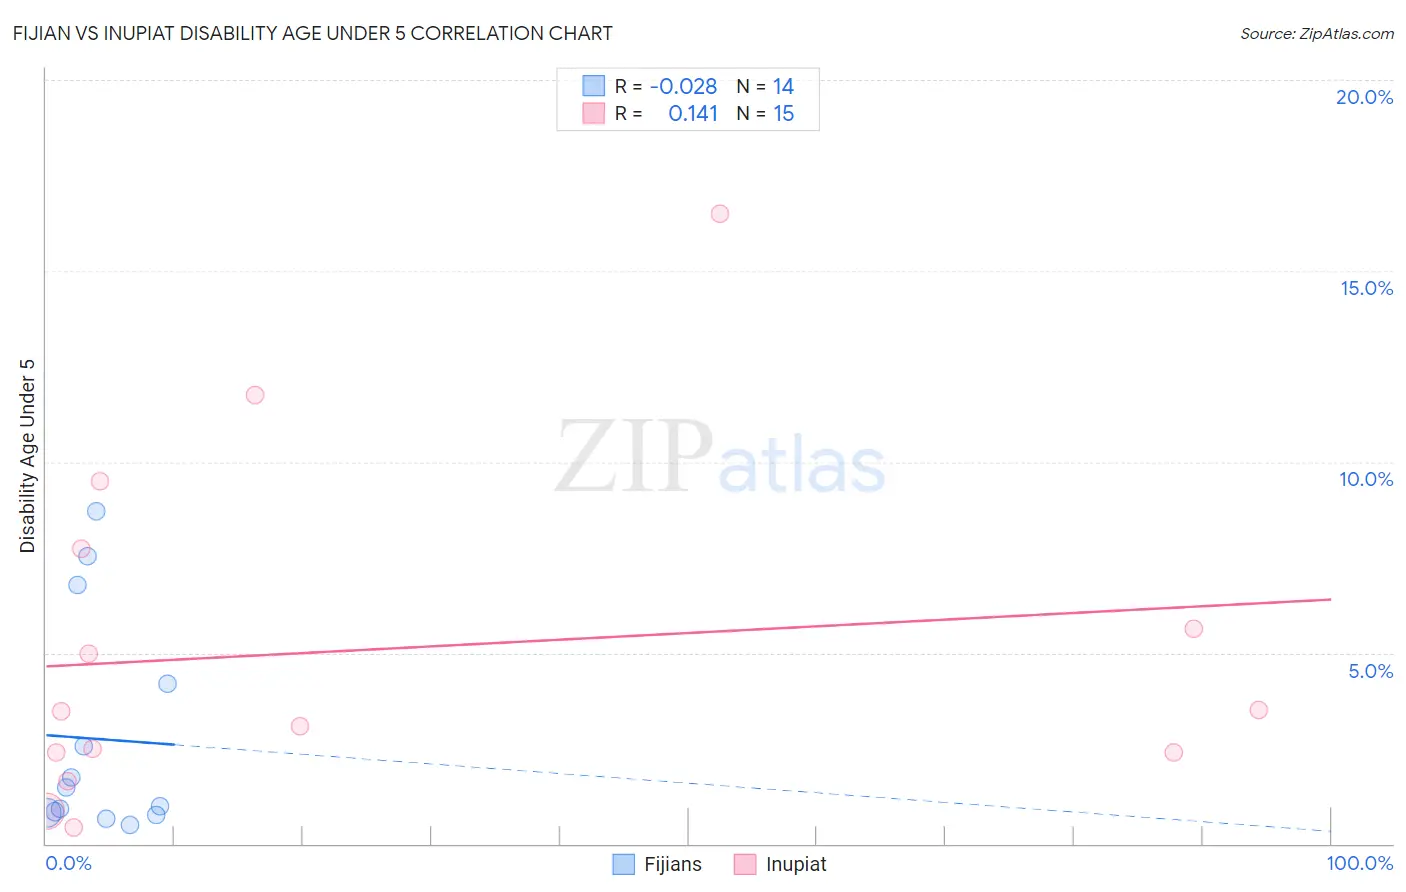
Fijian vs Inupiat Disability Age Under 5 Correlation Chart
The statistical analysis conducted on geographies consisting of 45,950,279 people shows no correlation between the proportion of Fijians and percentage of population with a disability under the age of 5 in the United States with a correlation coefficient (R) of -0.028 and weighted average of 1.2%. Similarly, the statistical analysis conducted on geographies consisting of 76,997,061 people shows a poor positive correlation between the proportion of Inupiat and percentage of population with a disability under the age of 5 in the United States with a correlation coefficient (R) of 0.141 and weighted average of 3.7%, a difference of 211.2%.
Disability Age Under 5 Correlation Summary
| Measurement | Fijian | Inupiat |
| Minimum | 0.50% | 0.42% |
| Maximum | 8.7% | 16.5% |
| Range | 8.2% | 16.1% |
| Mean | 2.7% | 5.1% |
| Median | 1.2% | 3.5% |
| Interquartile 25% (IQ1) | 0.81% | 2.4% |
| Interquartile 75% (IQ3) | 4.2% | 7.7% |
| Interquartile Range (IQR) | 3.4% | 5.4% |
| Standard Deviation (Sample) | 2.9% | 4.5% |
| Standard Deviation (Population) | 2.8% | 4.4% |
Similar Demographics by Disability Age Under 5
Demographics Similar to Fijians by Disability Age Under 5
In terms of disability age under 5, the demographic groups most similar to Fijians are Moroccan (1.2%, a difference of 0.18%), Argentinean (1.2%, a difference of 0.20%), Immigrants from Eastern Africa (1.2%, a difference of 0.27%), Immigrants from Czechoslovakia (1.2%, a difference of 0.32%), and Immigrants from Spain (1.2%, a difference of 0.36%).
| Demographics | Rating | Rank | Disability Age Under 5 |
| Immigrants | France | 88.4 /100 | #128 | Excellent 1.2% |
| Immigrants | Immigrants | 88.0 /100 | #129 | Excellent 1.2% |
| Koreans | 87.7 /100 | #130 | Excellent 1.2% |
| Immigrants | Serbia | 87.6 /100 | #131 | Excellent 1.2% |
| Immigrants | Eastern Europe | 87.3 /100 | #132 | Excellent 1.2% |
| Immigrants | Spain | 86.5 /100 | #133 | Excellent 1.2% |
| Argentineans | 85.7 /100 | #134 | Excellent 1.2% |
| Fijians | 84.7 /100 | #135 | Excellent 1.2% |
| Moroccans | 83.6 /100 | #136 | Excellent 1.2% |
| Immigrants | Eastern Africa | 83.1 /100 | #137 | Excellent 1.2% |
| Immigrants | Czechoslovakia | 82.8 /100 | #138 | Excellent 1.2% |
| New Zealanders | 81.4 /100 | #139 | Excellent 1.2% |
| Somalis | 80.8 /100 | #140 | Excellent 1.2% |
| Immigrants | Honduras | 80.4 /100 | #141 | Excellent 1.2% |
| Immigrants | Colombia | 79.3 /100 | #142 | Good 1.2% |
Demographics Similar to Inupiat by Disability Age Under 5
In terms of disability age under 5, the demographic groups most similar to Inupiat are Paiute (3.9%, a difference of 5.3%), Colville (3.3%, a difference of 13.0%), Yup'ik (4.5%, a difference of 22.0%), Hopi (4.6%, a difference of 24.8%), and Alaska Native (2.9%, a difference of 26.1%).
| Demographics | Rating | Rank | Disability Age Under 5 |
| Dutch West Indians | 0.0 /100 | #333 | Tragic 1.9% |
| Natives/Alaskans | 0.0 /100 | #334 | Tragic 1.9% |
| Pennsylvania Germans | 0.0 /100 | #335 | Tragic 1.9% |
| Paraguayans | 0.0 /100 | #336 | Tragic 2.0% |
| Apache | 0.0 /100 | #337 | Tragic 2.0% |
| Tohono O'odham | 0.0 /100 | #338 | Tragic 2.2% |
| Immigrants | Azores | 0.0 /100 | #339 | Tragic 2.2% |
| Menominee | 0.0 /100 | #340 | Tragic 2.3% |
| Tsimshian | 0.0 /100 | #341 | Tragic 2.4% |
| Alaska Natives | 0.0 /100 | #342 | Tragic 2.9% |
| Colville | 0.0 /100 | #343 | Tragic 3.3% |
| Inupiat | 0.0 /100 | #344 | Tragic 3.7% |
| Paiute | 0.0 /100 | #345 | Tragic 3.9% |
| Yup'ik | 0.0 /100 | #346 | Tragic 4.5% |
| Hopi | 0.0 /100 | #347 | Tragic 4.6% |