Immigrants from Taiwan vs Inupiat 8th Grade
COMPARE
Immigrants from Taiwan
Inupiat
8th Grade
8th Grade Comparison
Immigrants from Taiwan
Inupiat
95.9%
8TH GRADE
70.5/ 100
METRIC RATING
157th/ 347
METRIC RANK
97.0%
8TH GRADE
100.0/ 100
METRIC RATING
40th/ 347
METRIC RANK
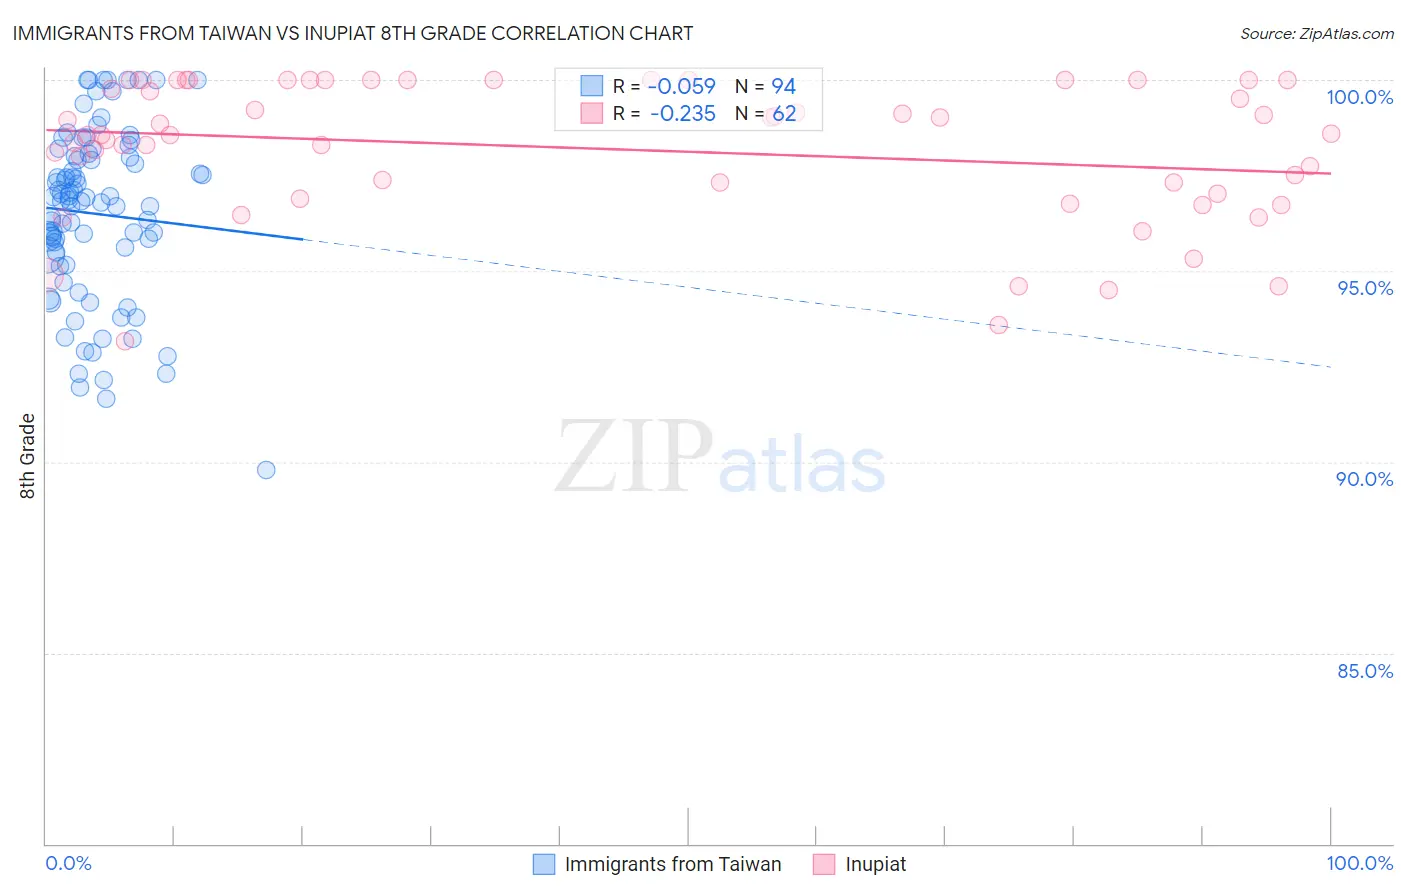
Immigrants from Taiwan vs Inupiat 8th Grade Correlation Chart
The statistical analysis conducted on geographies consisting of 298,069,199 people shows a slight negative correlation between the proportion of Immigrants from Taiwan and percentage of population with at least 8th grade education in the United States with a correlation coefficient (R) of -0.059 and weighted average of 95.9%. Similarly, the statistical analysis conducted on geographies consisting of 96,348,974 people shows a weak negative correlation between the proportion of Inupiat and percentage of population with at least 8th grade education in the United States with a correlation coefficient (R) of -0.235 and weighted average of 97.0%, a difference of 1.1%.
8th Grade Correlation Summary
| Measurement | Immigrants from Taiwan | Inupiat |
| Minimum | 89.8% | 93.2% |
| Maximum | 100.0% | 100.0% |
| Range | 10.2% | 6.8% |
| Mean | 96.5% | 98.2% |
| Median | 96.8% | 98.6% |
| Interquartile 25% (IQ1) | 95.4% | 97.0% |
| Interquartile 75% (IQ3) | 98.0% | 100.0% |
| Interquartile Range (IQR) | 2.6% | 3.0% |
| Standard Deviation (Sample) | 2.3% | 1.8% |
| Standard Deviation (Population) | 2.2% | 1.8% |
Similar Demographics by 8th Grade
Demographics Similar to Immigrants from Taiwan by 8th Grade
In terms of 8th grade, the demographic groups most similar to Immigrants from Taiwan are Arab (95.9%, a difference of 0.010%), Immigrants from Kazakhstan (95.9%, a difference of 0.020%), Seminole (95.8%, a difference of 0.020%), Bermudan (95.8%, a difference of 0.020%), and Kenyan (95.9%, a difference of 0.030%).
| Demographics | Rating | Rank | 8th Grade |
| Immigrants | Russia | 80.9 /100 | #150 | Excellent 96.0% |
| Blackfeet | 80.8 /100 | #151 | Excellent 96.0% |
| French American Indians | 80.6 /100 | #152 | Excellent 96.0% |
| Immigrants | Jordan | 79.5 /100 | #153 | Good 95.9% |
| Hopi | 79.4 /100 | #154 | Good 95.9% |
| Kenyans | 74.5 /100 | #155 | Good 95.9% |
| Ugandans | 74.1 /100 | #156 | Good 95.9% |
| Immigrants | Taiwan | 70.5 /100 | #157 | Good 95.9% |
| Arabs | 69.4 /100 | #158 | Good 95.9% |
| Immigrants | Kazakhstan | 68.4 /100 | #159 | Good 95.9% |
| Seminole | 67.7 /100 | #160 | Good 95.8% |
| Bermudans | 67.5 /100 | #161 | Good 95.8% |
| Immigrants | Kenya | 67.2 /100 | #162 | Good 95.8% |
| Immigrants | Sri Lanka | 64.1 /100 | #163 | Good 95.8% |
| Immigrants | Italy | 63.5 /100 | #164 | Good 95.8% |
Demographics Similar to Inupiat by 8th Grade
In terms of 8th grade, the demographic groups most similar to Inupiat are Eastern European (97.0%, a difference of 0.0%), Hungarian (97.0%, a difference of 0.010%), British (97.0%, a difference of 0.020%), Latvian (97.0%, a difference of 0.030%), and Alaska Native (97.0%, a difference of 0.040%).
| Demographics | Rating | Rank | 8th Grade |
| Swiss | 100.0 /100 | #33 | Exceptional 97.0% |
| Luxembourgers | 100.0 /100 | #34 | Exceptional 97.0% |
| Alaska Natives | 100.0 /100 | #35 | Exceptional 97.0% |
| Belgians | 100.0 /100 | #36 | Exceptional 97.0% |
| Latvians | 100.0 /100 | #37 | Exceptional 97.0% |
| British | 100.0 /100 | #38 | Exceptional 97.0% |
| Hungarians | 100.0 /100 | #39 | Exceptional 97.0% |
| Inupiat | 100.0 /100 | #40 | Exceptional 97.0% |
| Eastern Europeans | 100.0 /100 | #41 | Exceptional 97.0% |
| Chinese | 100.0 /100 | #42 | Exceptional 96.9% |
| Aleuts | 99.9 /100 | #43 | Exceptional 96.9% |
| Maltese | 99.9 /100 | #44 | Exceptional 96.9% |
| Northern Europeans | 99.9 /100 | #45 | Exceptional 96.9% |
| Czechoslovakians | 99.9 /100 | #46 | Exceptional 96.9% |
| Bulgarians | 99.9 /100 | #47 | Exceptional 96.9% |