Immigrants from Sweden vs Tongan Master's Degree
COMPARE
Immigrants from Sweden
Tongan
Master's Degree
Master's Degree Comparison
Immigrants from Sweden
Tongans
20.3%
MASTER'S DEGREE
100.0/ 100
METRIC RATING
24th/ 347
METRIC RANK
12.5%
MASTER'S DEGREE
0.6/ 100
METRIC RATING
261st/ 347
METRIC RANK
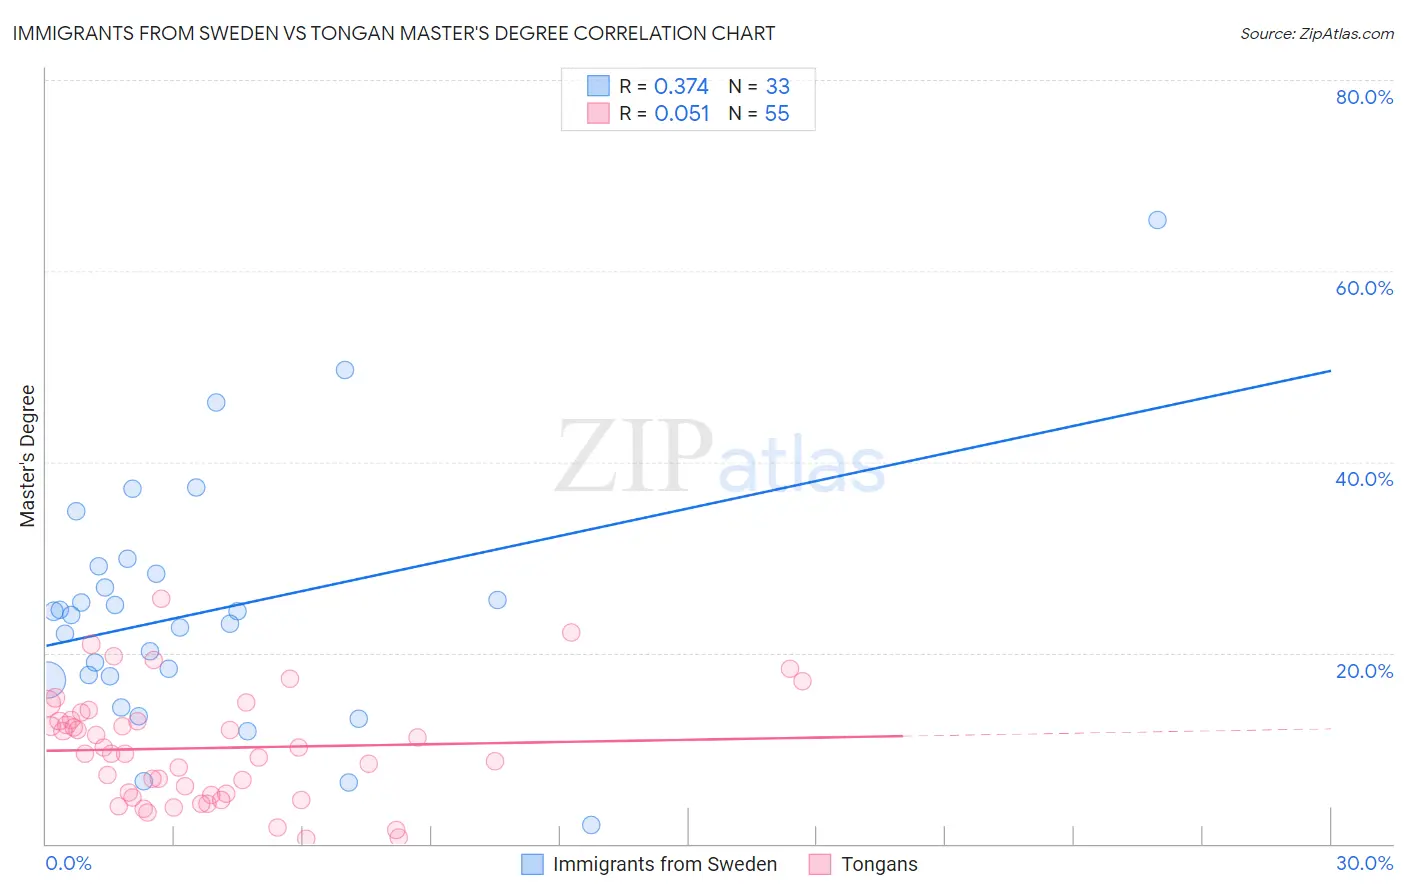
Immigrants from Sweden vs Tongan Master's Degree Correlation Chart
The statistical analysis conducted on geographies consisting of 164,715,920 people shows a mild positive correlation between the proportion of Immigrants from Sweden and percentage of population with at least master's degree education in the United States with a correlation coefficient (R) of 0.374 and weighted average of 20.3%. Similarly, the statistical analysis conducted on geographies consisting of 102,792,797 people shows a slight positive correlation between the proportion of Tongans and percentage of population with at least master's degree education in the United States with a correlation coefficient (R) of 0.051 and weighted average of 12.5%, a difference of 62.3%.
Master's Degree Correlation Summary
| Measurement | Immigrants from Sweden | Tongan |
| Minimum | 2.0% | 0.46% |
| Maximum | 65.4% | 25.6% |
| Range | 63.4% | 25.2% |
| Mean | 24.3% | 10.0% |
| Median | 24.0% | 9.5% |
| Interquartile 25% (IQ1) | 17.3% | 5.1% |
| Interquartile 75% (IQ3) | 28.6% | 13.0% |
| Interquartile Range (IQR) | 11.3% | 7.9% |
| Standard Deviation (Sample) | 12.7% | 5.8% |
| Standard Deviation (Population) | 12.5% | 5.7% |
Similar Demographics by Master's Degree
Demographics Similar to Immigrants from Sweden by Master's Degree
In terms of master's degree, the demographic groups most similar to Immigrants from Sweden are Immigrants from France (20.3%, a difference of 0.070%), Israeli (20.3%, a difference of 0.35%), Immigrants from Ireland (20.4%, a difference of 0.77%), Indian (Asian) (20.5%, a difference of 0.88%), and Immigrants from Hong Kong (20.5%, a difference of 0.90%).
| Demographics | Rating | Rank | Master's Degree |
| Immigrants | South Central Asia | 100.0 /100 | #17 | Exceptional 20.7% |
| Soviet Union | 100.0 /100 | #18 | Exceptional 20.5% |
| Immigrants | Hong Kong | 100.0 /100 | #19 | Exceptional 20.5% |
| Indians (Asian) | 100.0 /100 | #20 | Exceptional 20.5% |
| Immigrants | Ireland | 100.0 /100 | #21 | Exceptional 20.4% |
| Israelis | 100.0 /100 | #22 | Exceptional 20.3% |
| Immigrants | France | 100.0 /100 | #23 | Exceptional 20.3% |
| Immigrants | Sweden | 100.0 /100 | #24 | Exceptional 20.3% |
| Immigrants | Japan | 100.0 /100 | #25 | Exceptional 20.0% |
| Cambodians | 100.0 /100 | #26 | Exceptional 20.0% |
| Immigrants | Sri Lanka | 100.0 /100 | #27 | Exceptional 19.9% |
| Turks | 100.0 /100 | #28 | Exceptional 19.9% |
| Latvians | 100.0 /100 | #29 | Exceptional 19.8% |
| Immigrants | Turkey | 100.0 /100 | #30 | Exceptional 19.7% |
| Immigrants | Korea | 100.0 /100 | #31 | Exceptional 19.7% |
Demographics Similar to Tongans by Master's Degree
In terms of master's degree, the demographic groups most similar to Tongans are Japanese (12.5%, a difference of 0.040%), Dominican (12.5%, a difference of 0.040%), Immigrants from Liberia (12.5%, a difference of 0.13%), Nicaraguan (12.5%, a difference of 0.18%), and Central American Indian (12.4%, a difference of 0.42%).
| Demographics | Rating | Rank | Master's Degree |
| Indonesians | 0.8 /100 | #254 | Tragic 12.6% |
| Immigrants | Congo | 0.8 /100 | #255 | Tragic 12.6% |
| Immigrants | Portugal | 0.8 /100 | #256 | Tragic 12.6% |
| Osage | 0.7 /100 | #257 | Tragic 12.6% |
| Immigrants | Liberia | 0.6 /100 | #258 | Tragic 12.5% |
| Japanese | 0.6 /100 | #259 | Tragic 12.5% |
| Dominicans | 0.6 /100 | #260 | Tragic 12.5% |
| Tongans | 0.6 /100 | #261 | Tragic 12.5% |
| Nicaraguans | 0.6 /100 | #262 | Tragic 12.5% |
| Central American Indians | 0.5 /100 | #263 | Tragic 12.4% |
| Belizeans | 0.5 /100 | #264 | Tragic 12.4% |
| Immigrants | Fiji | 0.5 /100 | #265 | Tragic 12.4% |
| Bahamians | 0.5 /100 | #266 | Tragic 12.4% |
| Americans | 0.4 /100 | #267 | Tragic 12.3% |
| Native Hawaiians | 0.4 /100 | #268 | Tragic 12.3% |